Fig. 2
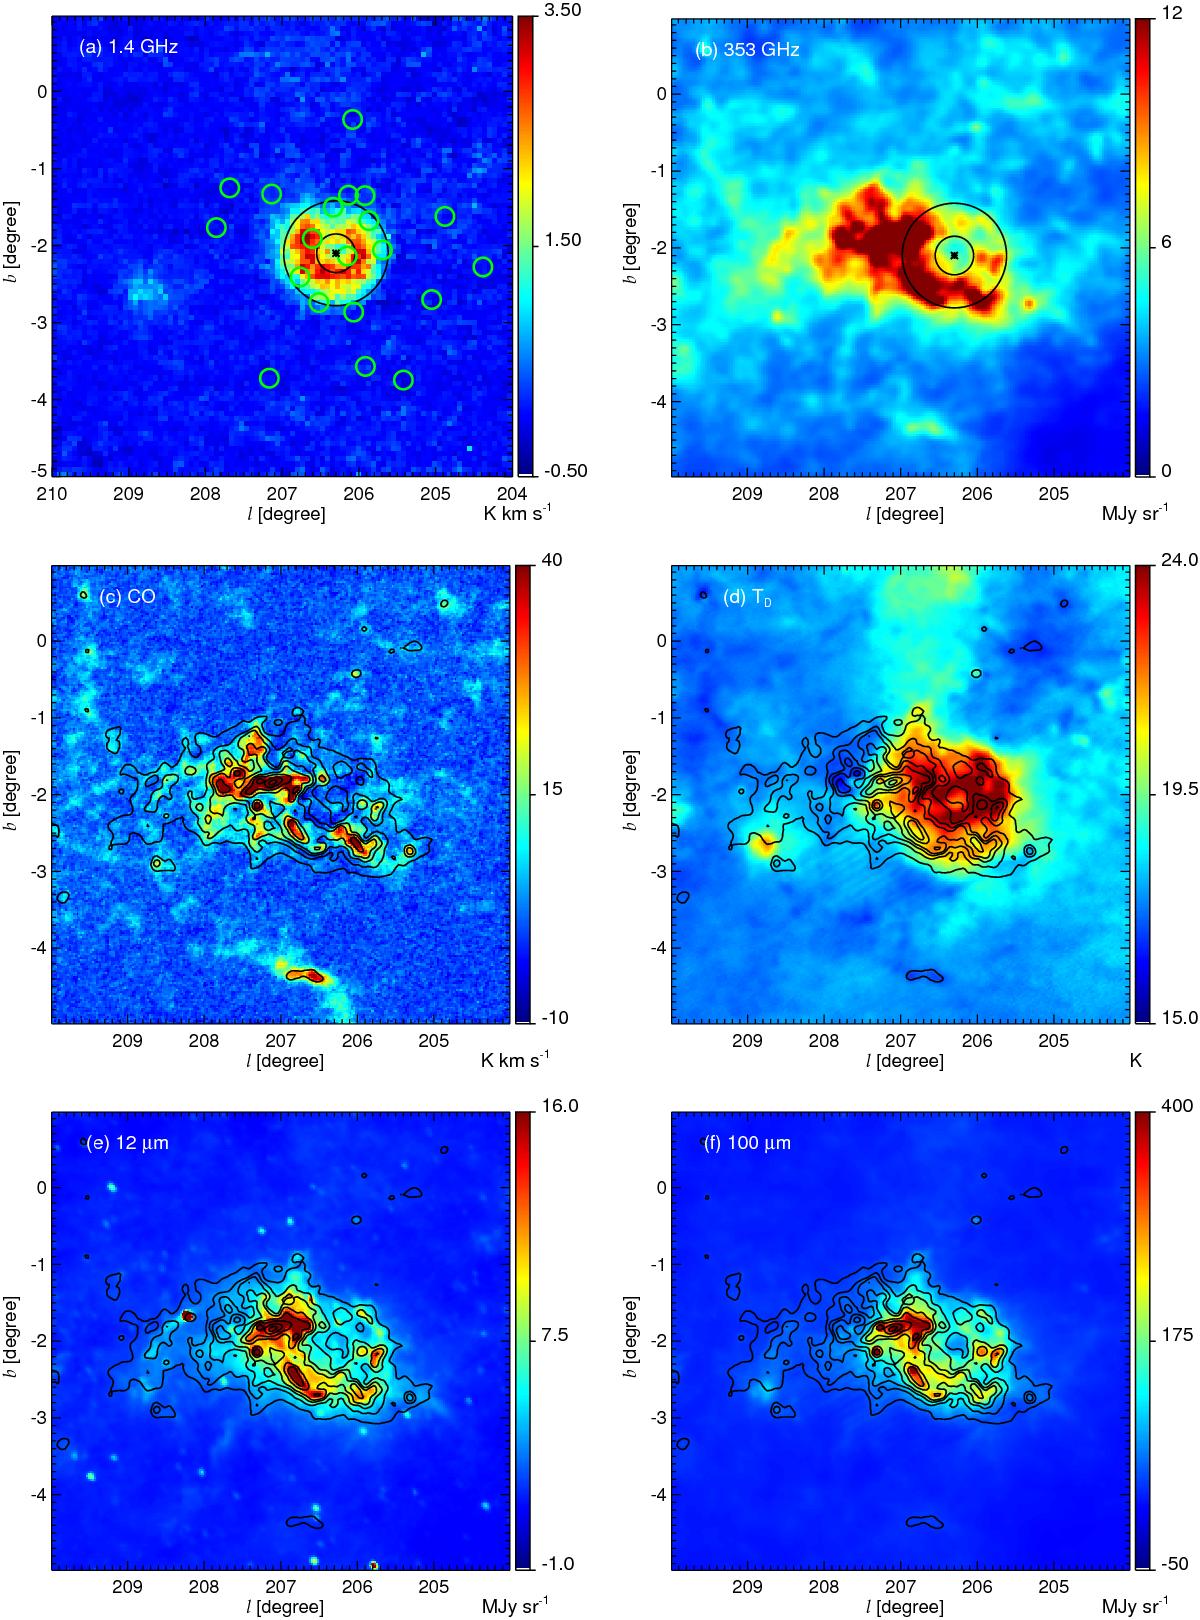
The Rosette Nebula and its molecular cloud. a) Integrated RRL emission at ![]() resolution, showing the radio morphology of the H ii region. The green circles, with a diameter equivalent to the beam full width at half maximum (FWHM) of the RRL data, give the position of the 20 RM observations of Savage et al. (2013) used in this work. b) Planck 353 GHz emission at 6′ resolution. The black star in panels a) and b) indicates the position of the central star cluster NGC 2244 and the black circles correspond to the inner and outer radii of the H ii region,
resolution, showing the radio morphology of the H ii region. The green circles, with a diameter equivalent to the beam full width at half maximum (FWHM) of the RRL data, give the position of the 20 RM observations of Savage et al. (2013) used in this work. b) Planck 353 GHz emission at 6′ resolution. The black star in panels a) and b) indicates the position of the central star cluster NGC 2244 and the black circles correspond to the inner and outer radii of the H ii region, ![]() pc and
pc and ![]() pc, respectively (see Sect. 4.2.2). c) Planck CO integrated intensity at
pc, respectively (see Sect. 4.2.2). c) Planck CO integrated intensity at ![]() resolution. d) Dust temperature derived from Planck at 5′ resolution. e) Dust emission as seen by IRAS at 12 μm and at 100 μm (f), at 4′ resolution. The contours in panels c) to f) show the Planck 353 GHz emission; these are at every 5% from 15 to 30%, at every 10% from 30 to 50%, and finally at 70 and 90% of the maximum intensity of 37 MJy sr-1.
resolution. d) Dust temperature derived from Planck at 5′ resolution. e) Dust emission as seen by IRAS at 12 μm and at 100 μm (f), at 4′ resolution. The contours in panels c) to f) show the Planck 353 GHz emission; these are at every 5% from 15 to 30%, at every 10% from 30 to 50%, and finally at 70 and 90% of the maximum intensity of 37 MJy sr-1.
Current usage metrics show cumulative count of Article Views (full-text article views including HTML views, PDF and ePub downloads, according to the available data) and Abstracts Views on Vision4Press platform.
Data correspond to usage on the plateform after 2015. The current usage metrics is available 48-96 hours after online publication and is updated daily on week days.
Initial download of the metrics may take a while.