Fig. A.4
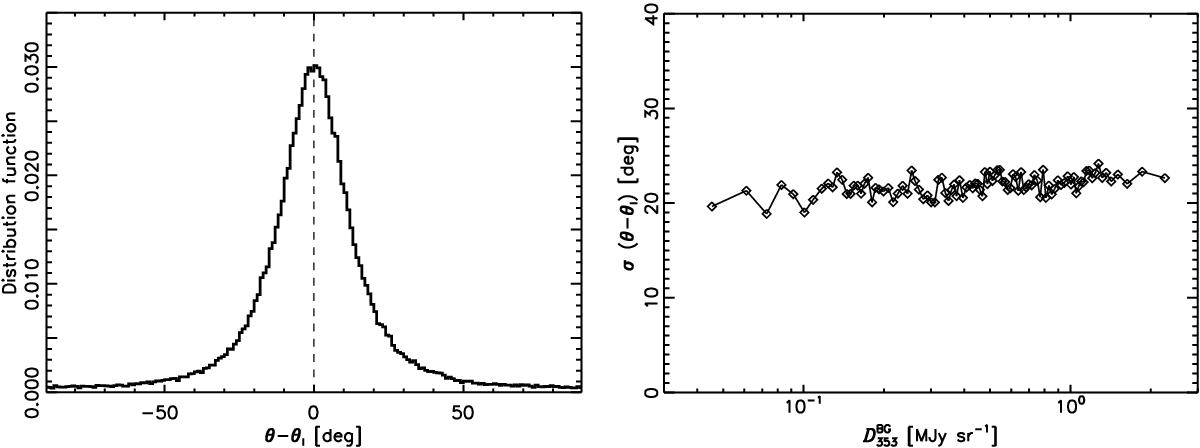
Left: distribution function of the difference between the angles of brightness structures in the dust emission map derived from the Hessian (θ) and inertia (θI) analysis. This comparison between the two independent algorithms provides the uncertainty of the Hessian angles that is smaller than the dispersion between the Hessian and polarization angles (Sect. 6). Right: the standard deviation of the difference between the Hessian and inertia angles (θ − θI) computed within bins of ![]() .
.
Current usage metrics show cumulative count of Article Views (full-text article views including HTML views, PDF and ePub downloads, according to the available data) and Abstracts Views on Vision4Press platform.
Data correspond to usage on the plateform after 2015. The current usage metrics is available 48-96 hours after online publication and is updated daily on week days.
Initial download of the metrics may take a while.