Fig. 19
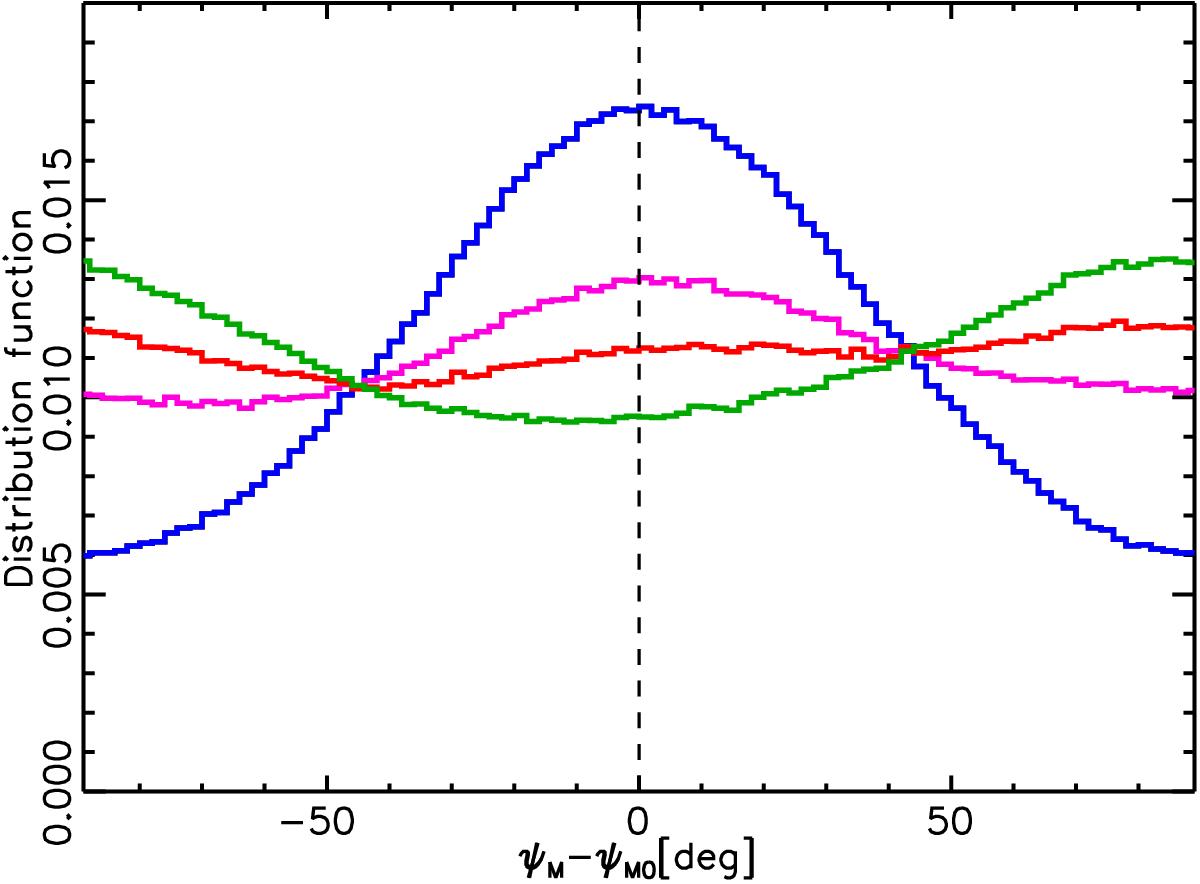
Distribution functions of relative orientations for the Gaussian model with σM = 33°. The distributions show the effects of projection onto the plane of the sky of the 3D relative orientations between VM and VM0. The curves refer to four different configurations depending on η, the fraction of 3D perpendicular orientations between the two vectors. For the blue curve, η = 0. For the pink, red, and green curves, η is 0.5, 0.7 and 0.9, respectively.
Current usage metrics show cumulative count of Article Views (full-text article views including HTML views, PDF and ePub downloads, according to the available data) and Abstracts Views on Vision4Press platform.
Data correspond to usage on the plateform after 2015. The current usage metrics is available 48-96 hours after online publication and is updated daily on week days.
Initial download of the metrics may take a while.