Fig. 17
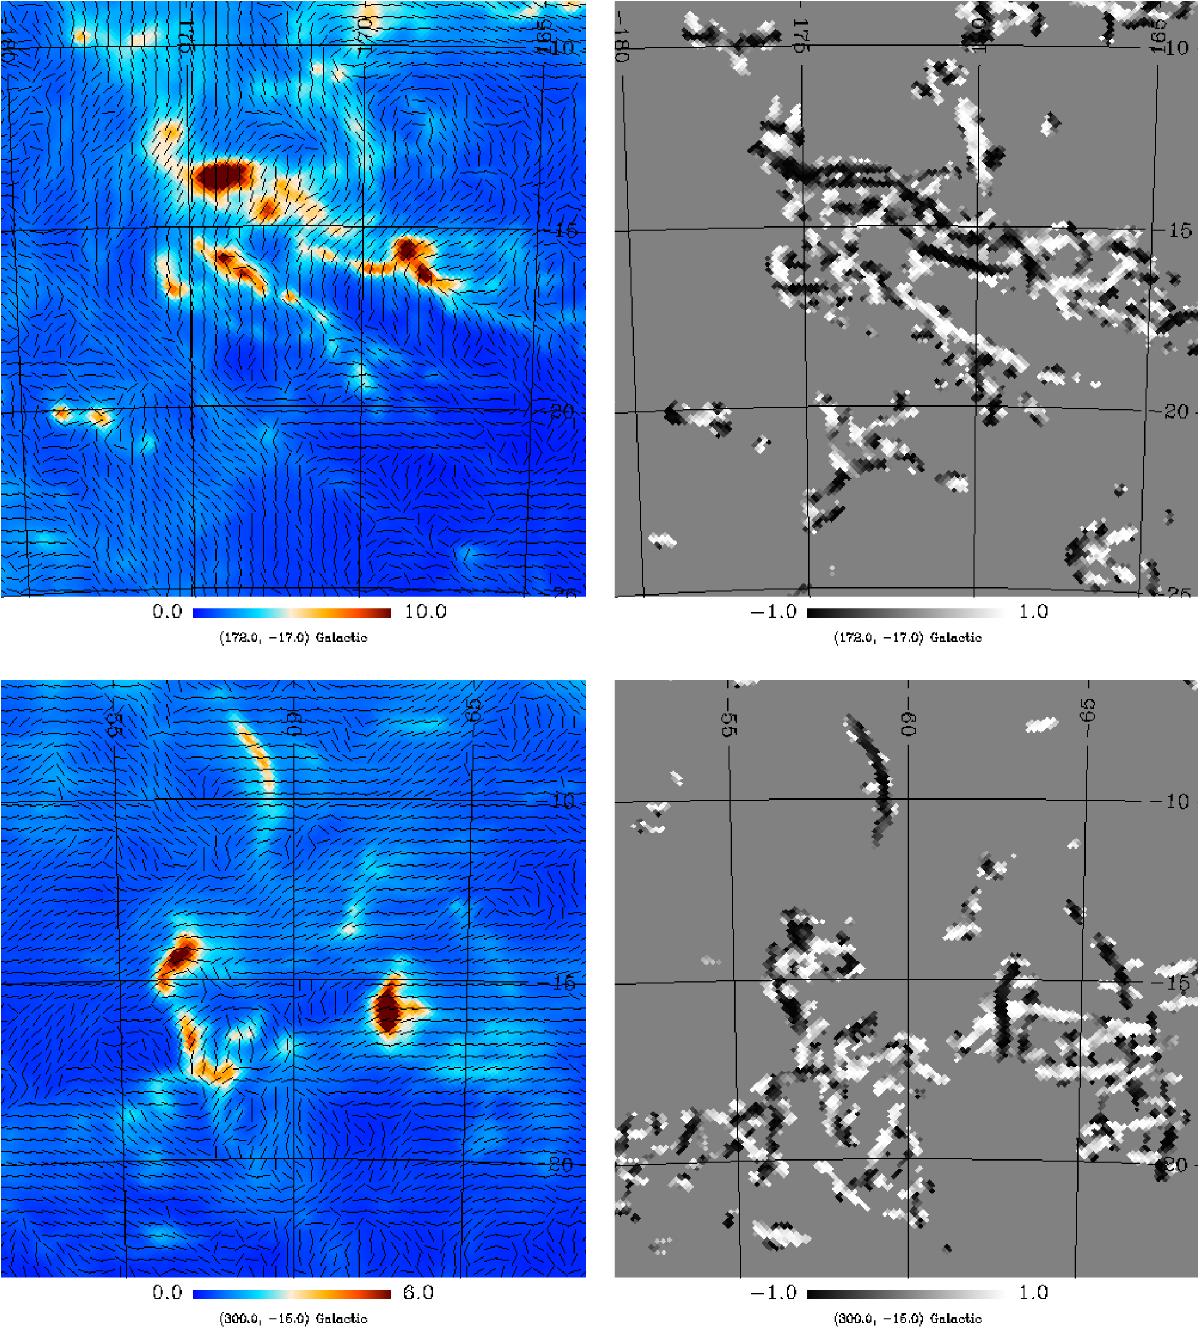
Left: maps of the visual extinction AV derived from the sub-mm dust opacity from Planck Collaboration XI (2014) at the 15′ resolution of our analysis for the Taurus molecular cloud (top), and the Chamaeleon molecular complex including the Musca filament (bottom). The vectors tracing the magnetic field orientation, computed from ![]() and
and ![]() , are plotted with a fixed length. Right: corresponding maps of the relative orientation between matter structures and magnetic field quantified by cos2Θ for the selected structures (Sect. 4). This figure shows coherent structures where the cosine is either positive or negative, corresponding to a magnetic field aligned with, or perpendicular to the structures.
, are plotted with a fixed length. Right: corresponding maps of the relative orientation between matter structures and magnetic field quantified by cos2Θ for the selected structures (Sect. 4). This figure shows coherent structures where the cosine is either positive or negative, corresponding to a magnetic field aligned with, or perpendicular to the structures.
Current usage metrics show cumulative count of Article Views (full-text article views including HTML views, PDF and ePub downloads, according to the available data) and Abstracts Views on Vision4Press platform.
Data correspond to usage on the plateform after 2015. The current usage metrics is available 48-96 hours after online publication and is updated daily on week days.
Initial download of the metrics may take a while.