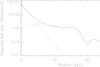
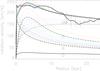
Fig. 5
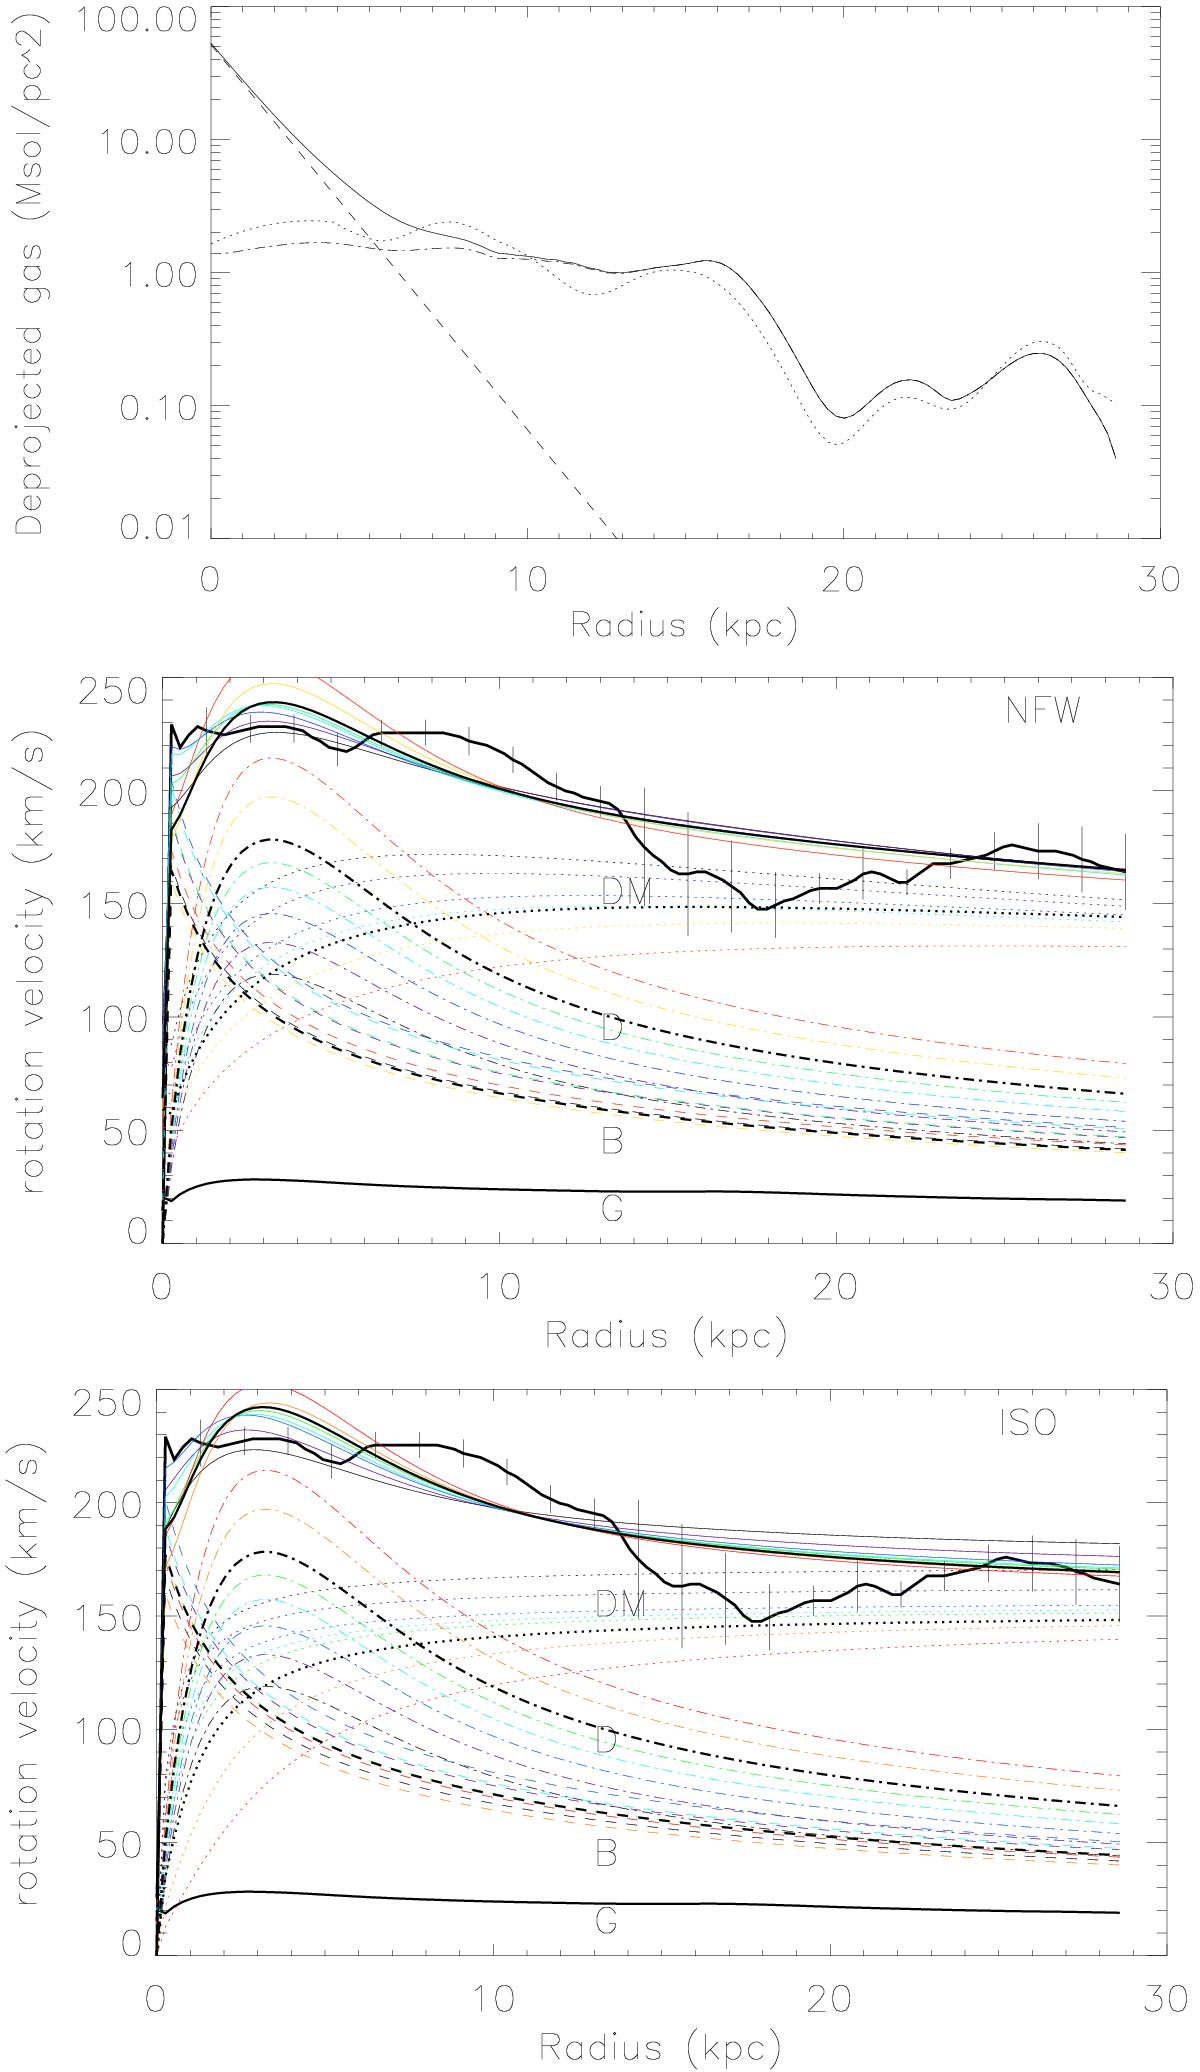
Radial profiles of NGC 2683. Upper panel: deprojected total (solid), atomic (dash-dotted), and assumed molecular (dashed) gas surface density based on SEST CO-line observations (see Sect. 4). The dotted line represents the symmetric deprojected Hi profile obtained from the method of Warmels (1988). Lower panel: observed and modeled rotation curve (solid), component due to the stellar bulge and disk (dashed), gas (dash-dotted), and dark matter halo (dotted). The colors indicate different K′ band mass-to-light ratios from blue (0.5) to red (1.3).
Current usage metrics show cumulative count of Article Views (full-text article views including HTML views, PDF and ePub downloads, according to the available data) and Abstracts Views on Vision4Press platform.
Data correspond to usage on the plateform after 2015. The current usage metrics is available 48-96 hours after online publication and is updated daily on week days.
Initial download of the metrics may take a while.