Free Access
Fig. C.1
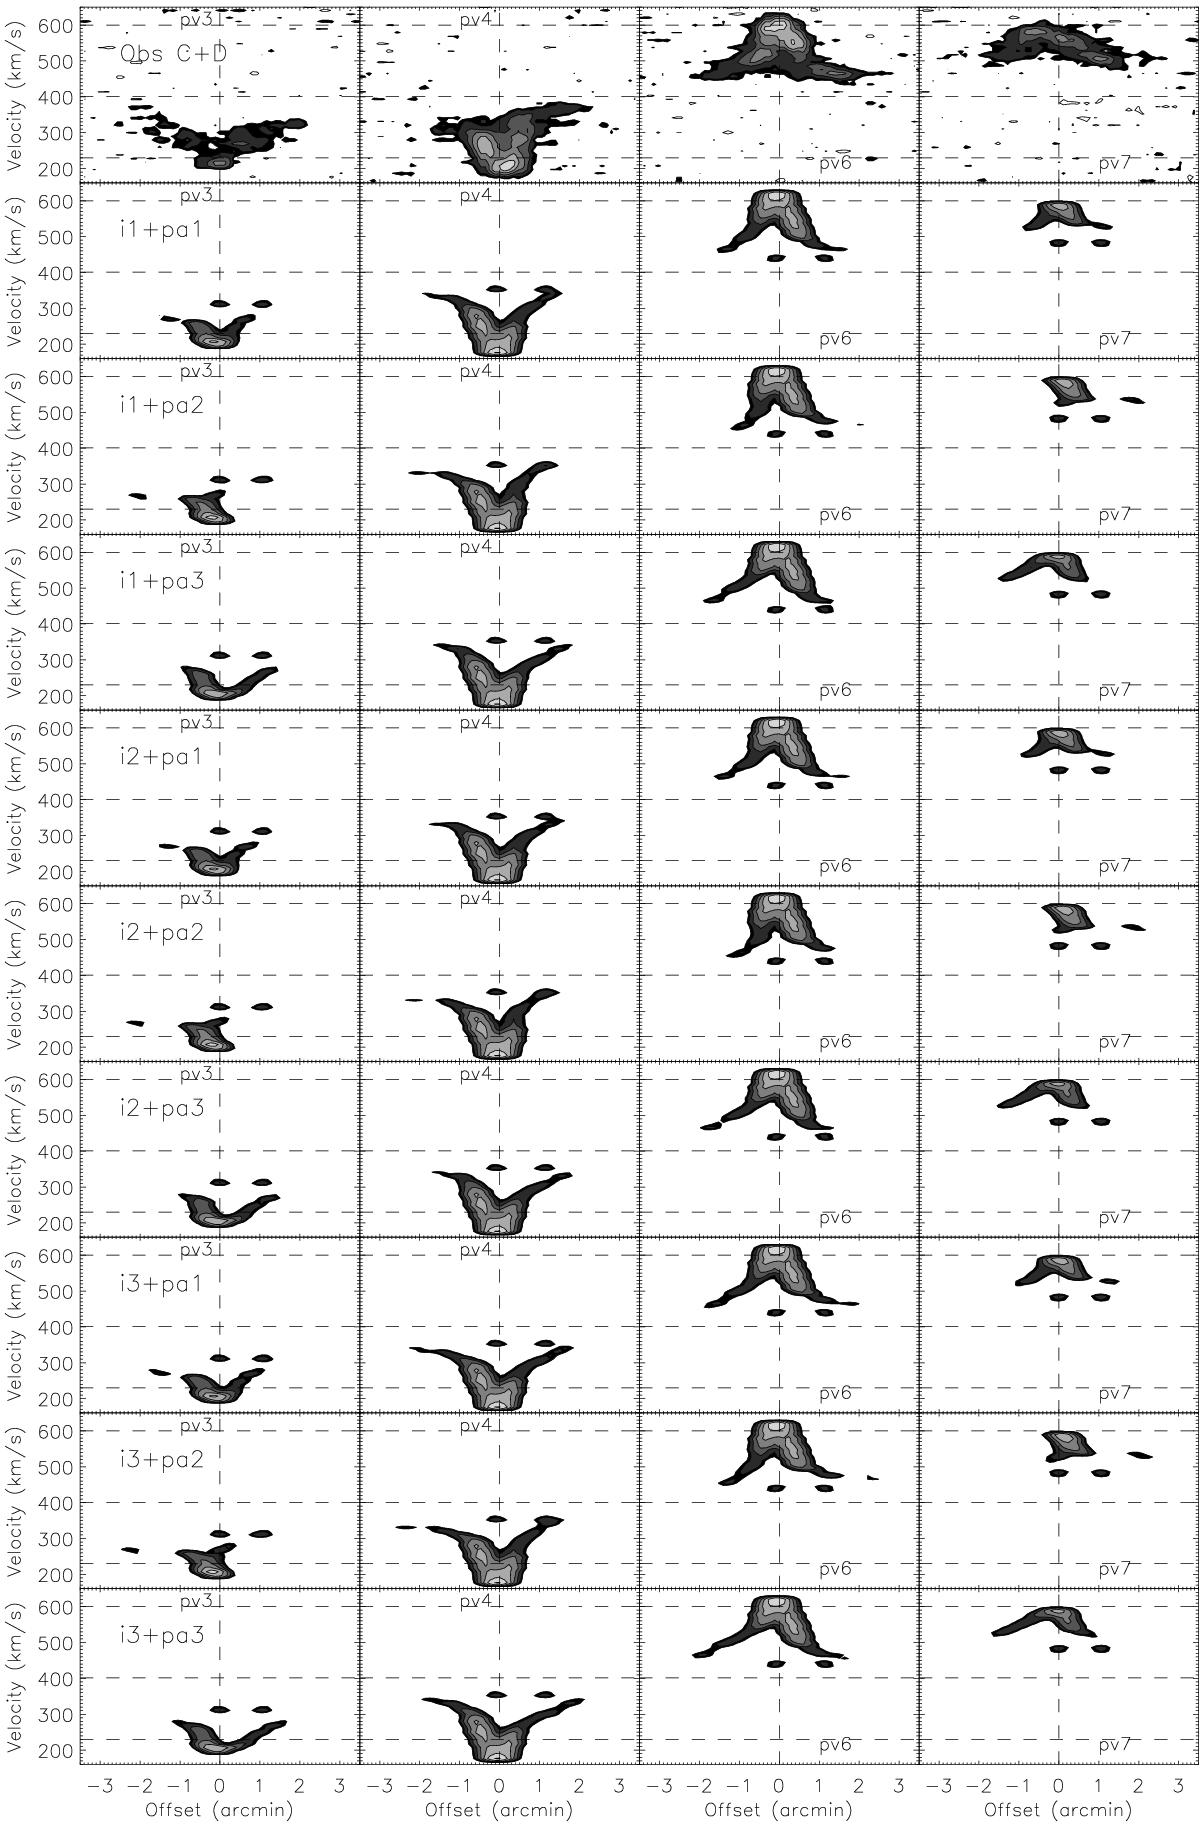
NGC 2683 Hi C+D array and model position velocity diagrams. The contour levels are (− 2,2,3,6,12,24,48,96) × 0.3 mJy/beam. The resolution is 19′′ × 18′′. The different warp models refer to the profiles of Fig. 8.
Current usage metrics show cumulative count of Article Views (full-text article views including HTML views, PDF and ePub downloads, according to the available data) and Abstracts Views on Vision4Press platform.
Data correspond to usage on the plateform after 2015. The current usage metrics is available 48-96 hours after online publication and is updated daily on week days.
Initial download of the metrics may take a while.