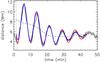
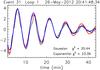
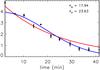
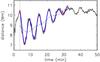
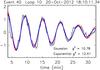
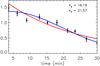
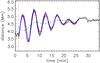
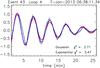
Fig. 2

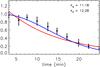
Examples of damped kink oscillations for which a Gaussian envelope is found to be a better fit than an exponential envelope. The left panels shows the position of the loop axis as a function of time, fitted with sinusoids with a Gaussian (blue lines) and exponential (red lines) damping envelope. The vertical dotted lines and dashed lines denote the start time t0 and the background trend, respectively. The middle panels show the detrended oscillations, while the panels on the right show the absolute values of the extrema with fitted envelopes.
Current usage metrics show cumulative count of Article Views (full-text article views including HTML views, PDF and ePub downloads, according to the available data) and Abstracts Views on Vision4Press platform.
Data correspond to usage on the plateform after 2015. The current usage metrics is available 48-96 hours after online publication and is updated daily on week days.
Initial download of the metrics may take a while.