Free Access
Fig. A.1
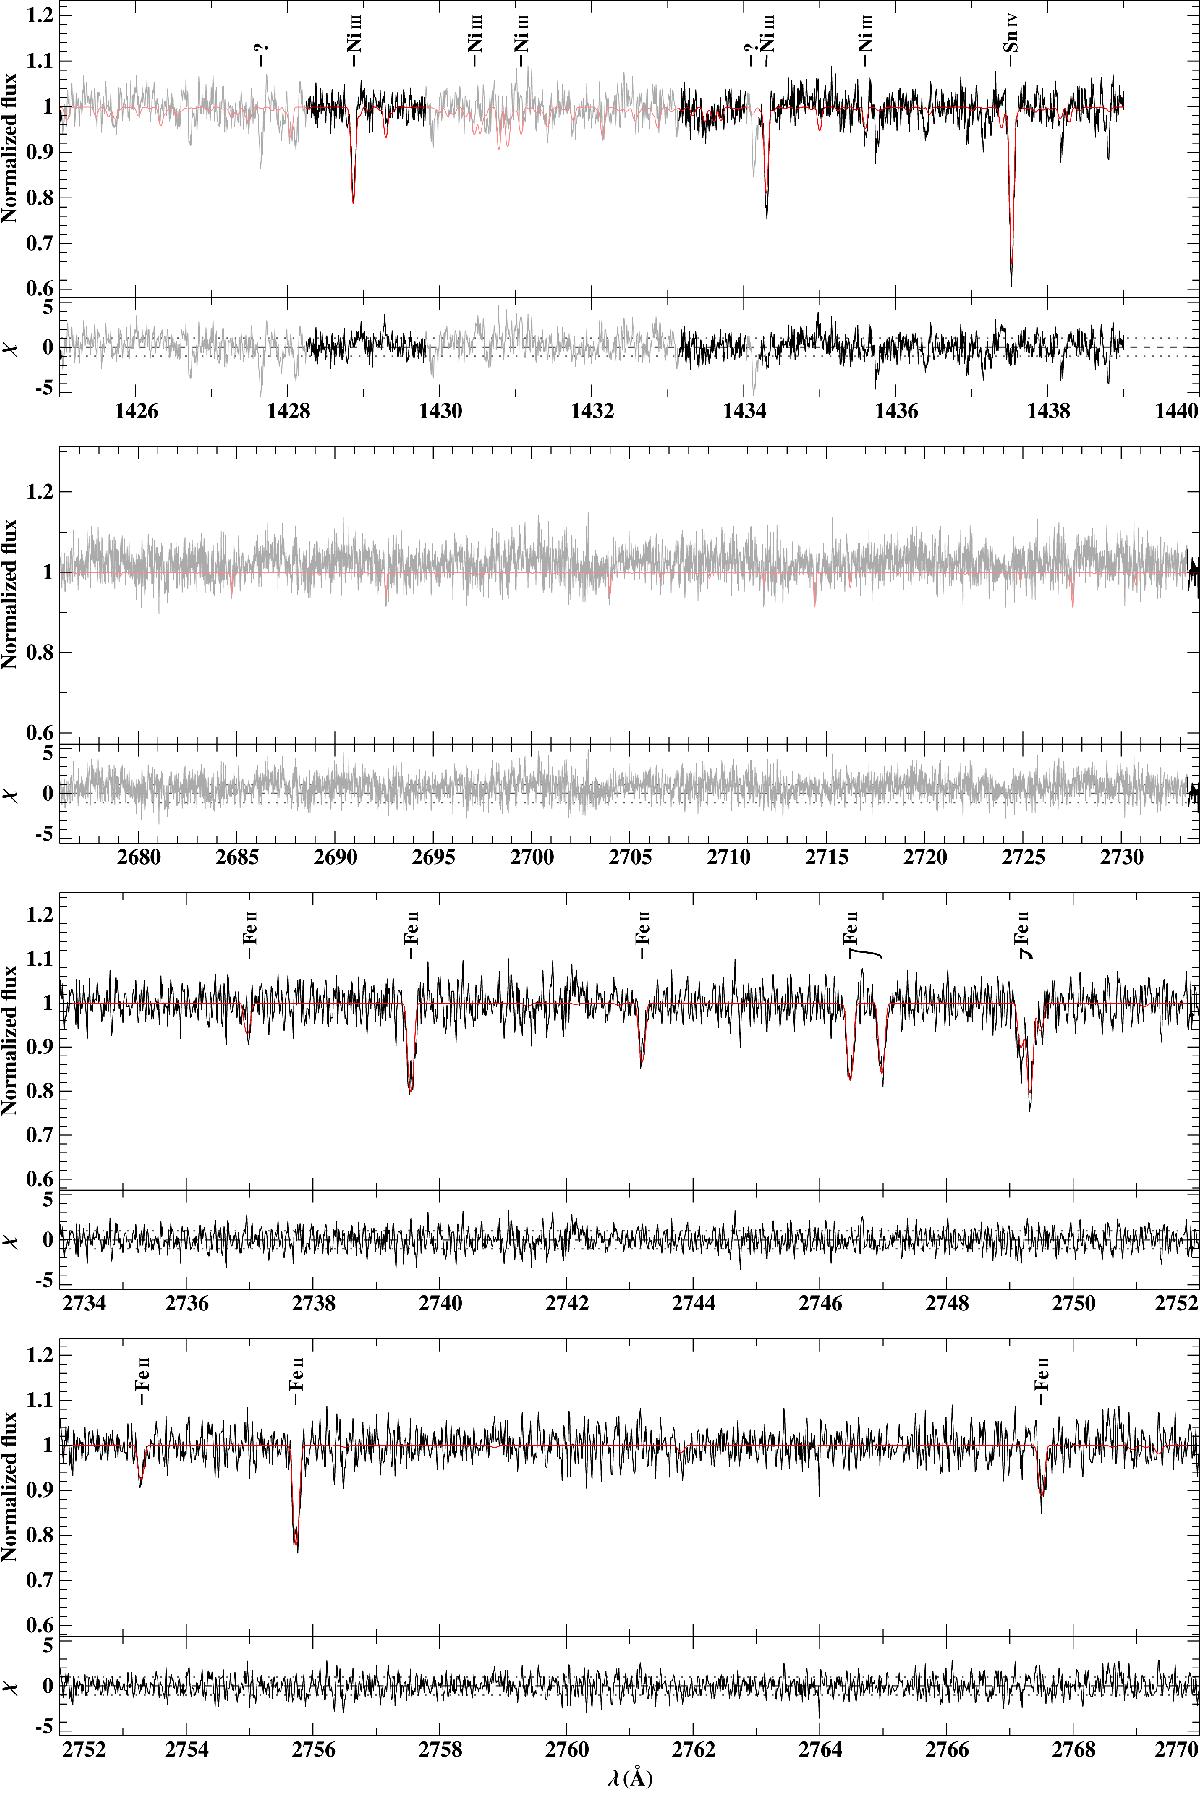
continued. Here starts the NUV2 spectrum. The scaling of the wavelength varies to include the spectral intervals devoid of fitted lines in unique panels. The iron abundance was set to the value derived with the Fe ii lines.
Current usage metrics show cumulative count of Article Views (full-text article views including HTML views, PDF and ePub downloads, according to the available data) and Abstracts Views on Vision4Press platform.
Data correspond to usage on the plateform after 2015. The current usage metrics is available 48-96 hours after online publication and is updated daily on week days.
Initial download of the metrics may take a while.