Fig. A.1
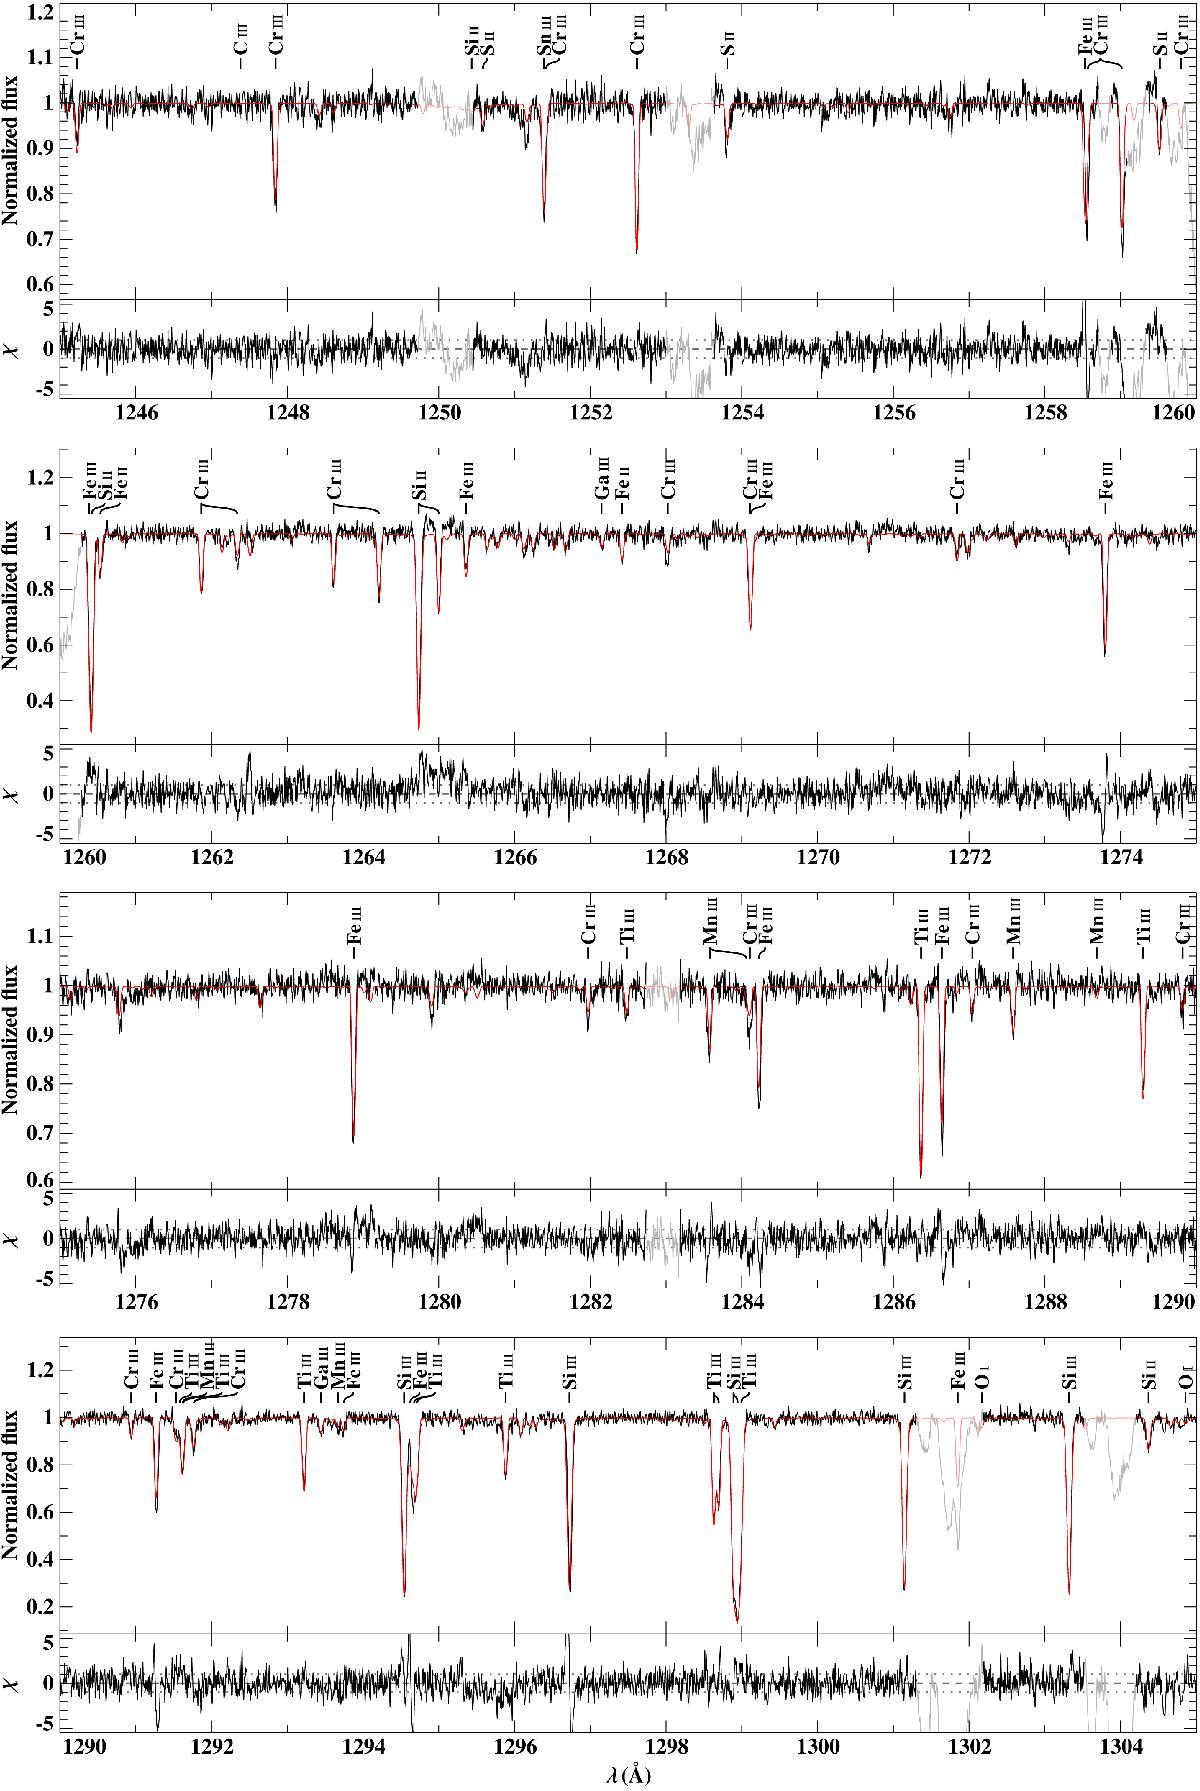
Entirety of our UV spectra of HD 188112, compared with our best fitting model. The bottom of each panel features the difference between the observation and the model divided by the noise as χ. The portions of the spectrum plotted in grey are regions excluded from the fits. Most of them feature blueshifted IS lines. The IS lines are artificially broadened by the RV correction applied to the individual spectra and show two components due to a time gap in the series of FUV spectra. For this panel, the abundance of Sn was set to the value matching the Sn iii line.
Current usage metrics show cumulative count of Article Views (full-text article views including HTML views, PDF and ePub downloads, according to the available data) and Abstracts Views on Vision4Press platform.
Data correspond to usage on the plateform after 2015. The current usage metrics is available 48-96 hours after online publication and is updated daily on week days.
Initial download of the metrics may take a while.