Fig. 5
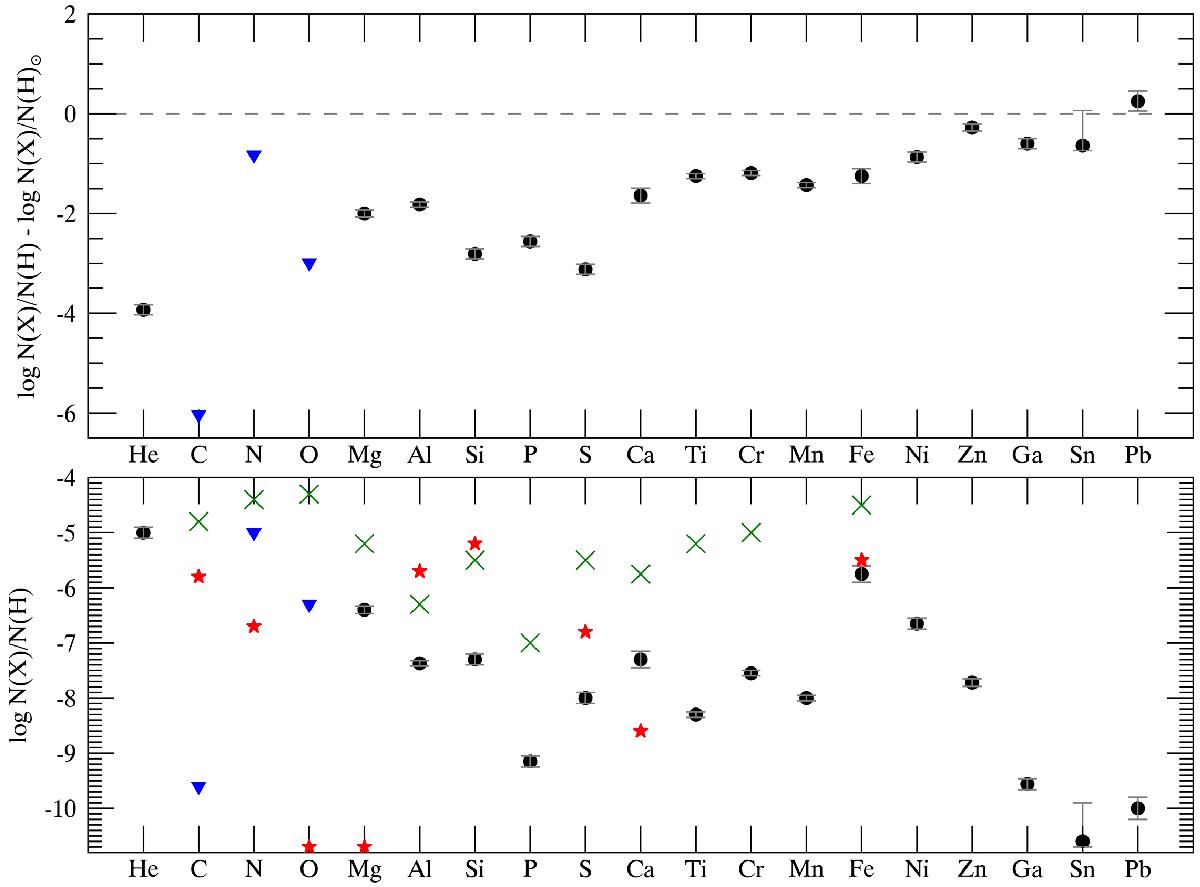
Summary of the determined chemical composition of HD 188112. The top panel shows the abundances relative to the solar ones (Asplund et al. 2009) and the bottom panel the absolute values. Down-pointing triangles indicate upper limits determined for C, N, and O. The stars in the bottom panel indicate abundances predicted by radiative levitation (P. Chayer, priv. comm.). No support is expected for oxygen and magnesium, thus the stars are at the bottom of the plot. The green crosses indicate the average abundances for sdB stars.
Current usage metrics show cumulative count of Article Views (full-text article views including HTML views, PDF and ePub downloads, according to the available data) and Abstracts Views on Vision4Press platform.
Data correspond to usage on the plateform after 2015. The current usage metrics is available 48-96 hours after online publication and is updated daily on week days.
Initial download of the metrics may take a while.