Free Access
Fig. 4
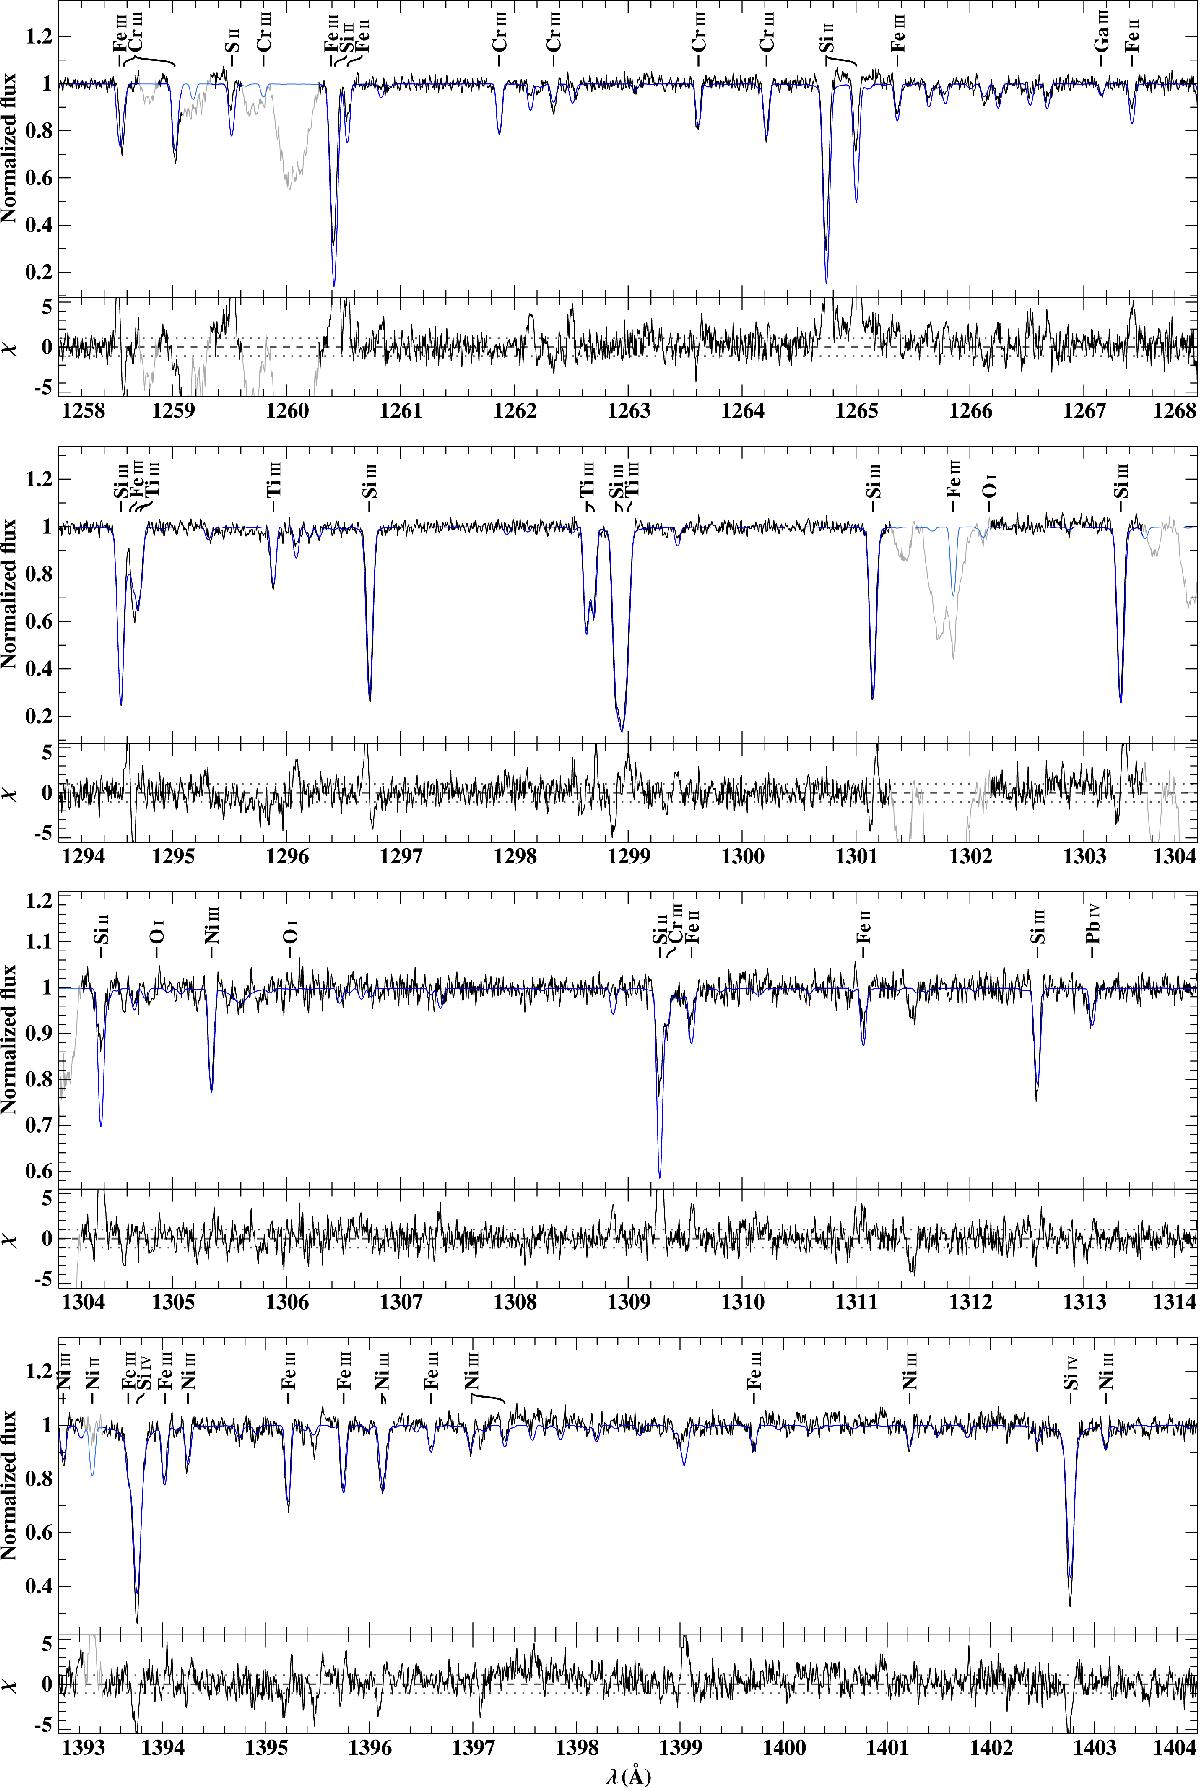
Comparison between parts of the FUV spectrum featuring mainly the Si lines and an LTE model spectrum, in blue. The LTE model was computed using the NLTE abundances stated in Table 1. The Si ii, Fe ii, and S ii lines appear to be much stronger than their observed counterparts, while the Si iii lines are nicely reproduced.
Current usage metrics show cumulative count of Article Views (full-text article views including HTML views, PDF and ePub downloads, according to the available data) and Abstracts Views on Vision4Press platform.
Data correspond to usage on the plateform after 2015. The current usage metrics is available 48-96 hours after online publication and is updated daily on week days.
Initial download of the metrics may take a while.