Fig. 3
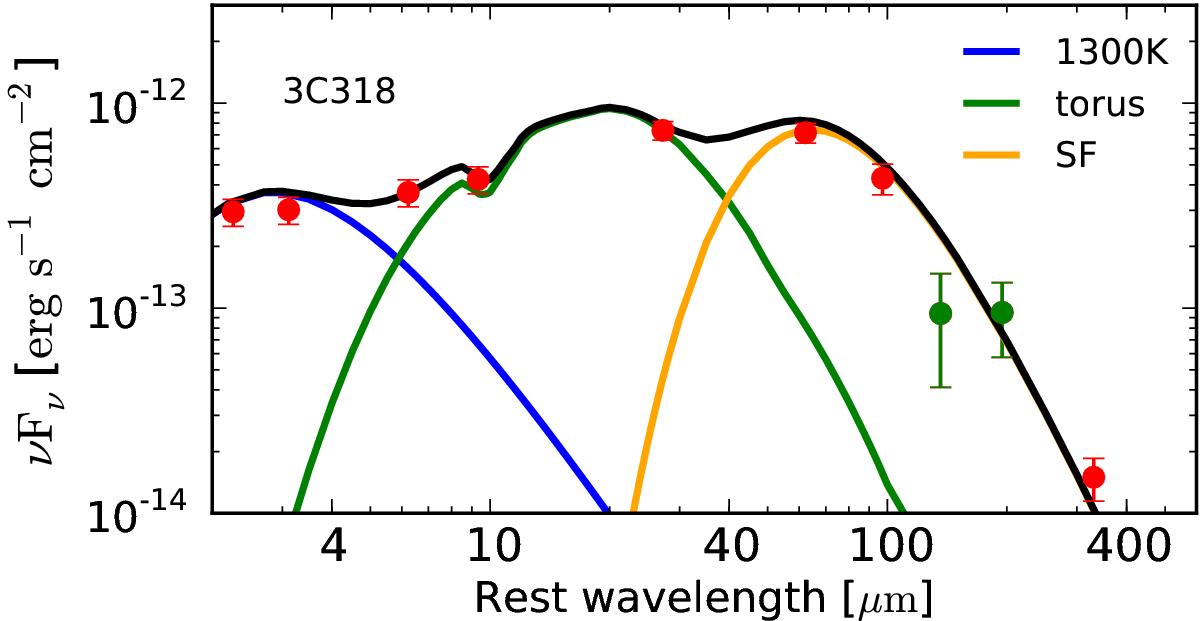
Best-fit infrared spectral energy distribution (SED) of the quasar 3C 318. Red circles represent the observed photometry, and green circles the estimated photometry (see text). The total SED (black) is given as the sum of AGN-heated hot dust close to sublimation temperature (blue), of torus emission (green, from the library of Hönig & Kishimoto 2010), and of star-formation-heated dust (yellow).
Current usage metrics show cumulative count of Article Views (full-text article views including HTML views, PDF and ePub downloads, according to the available data) and Abstracts Views on Vision4Press platform.
Data correspond to usage on the plateform after 2015. The current usage metrics is available 48-96 hours after online publication and is updated daily on week days.
Initial download of the metrics may take a while.