Fig. 2
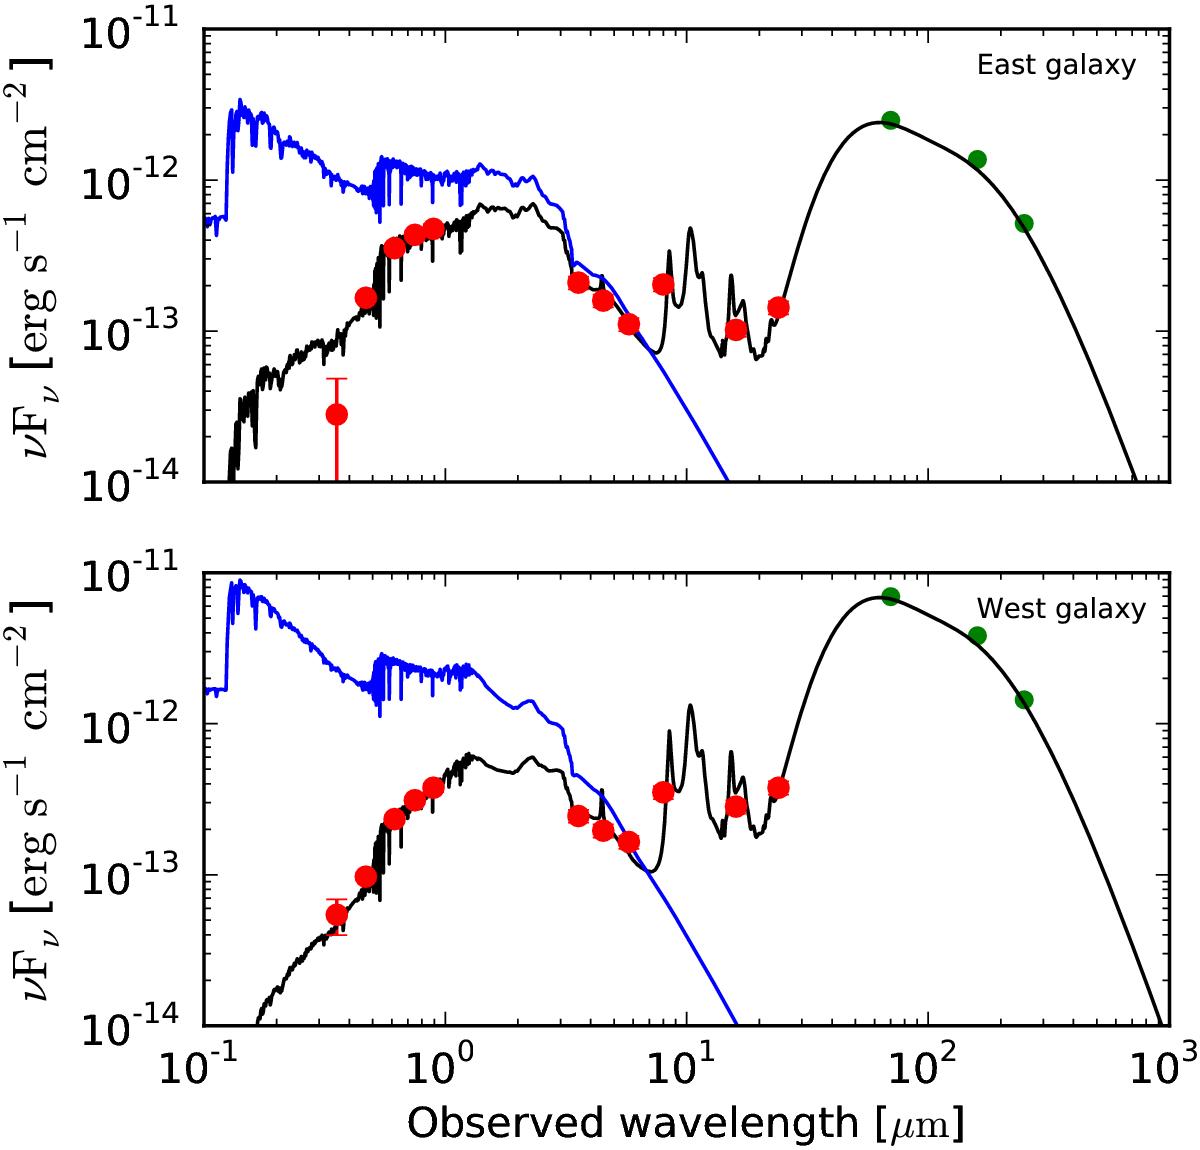
MAGPHYS best-fit spectral energy distributions (SEDs) of the interacting pair close (in projection) to 3C 318. Top: the East galaxy. Bottom: the West galaxy. The observed (Spitzer and SDSS) photometry is listed in Table 1, and plotted with red circles. The blue and black solid lines, respectively, correspond to the unattenuated and attenuated best-fit SEDs. Green circles represent the photometry at the three shortest Herschel bands, estimated using the computed infrared luminosity ratio and the measured integrated Herschel flux density (see text).
Current usage metrics show cumulative count of Article Views (full-text article views including HTML views, PDF and ePub downloads, according to the available data) and Abstracts Views on Vision4Press platform.
Data correspond to usage on the plateform after 2015. The current usage metrics is available 48-96 hours after online publication and is updated daily on week days.
Initial download of the metrics may take a while.