Free Access
Fig. 6
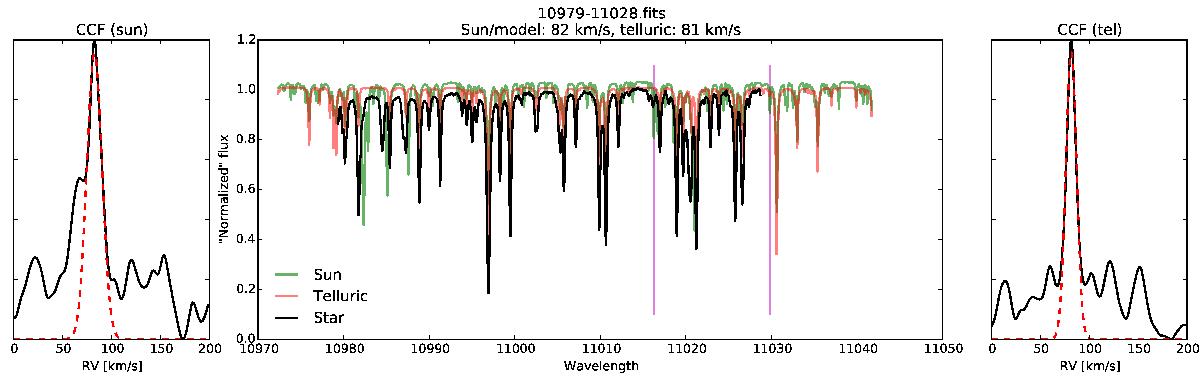
Middle plot: piece of HD 20010 (black), the model spectrum, in this case the Sun (green), a telluric spectrum (red), and two lines from our line list (magenta vertical lines). Left plot: CCF of the Sun with a fitted Gaussian. Right plot: same as the one to the left, but for the telluric spectrum.
Current usage metrics show cumulative count of Article Views (full-text article views including HTML views, PDF and ePub downloads, according to the available data) and Abstracts Views on Vision4Press platform.
Data correspond to usage on the plateform after 2015. The current usage metrics is available 48-96 hours after online publication and is updated daily on week days.
Initial download of the metrics may take a while.