Fig. 9
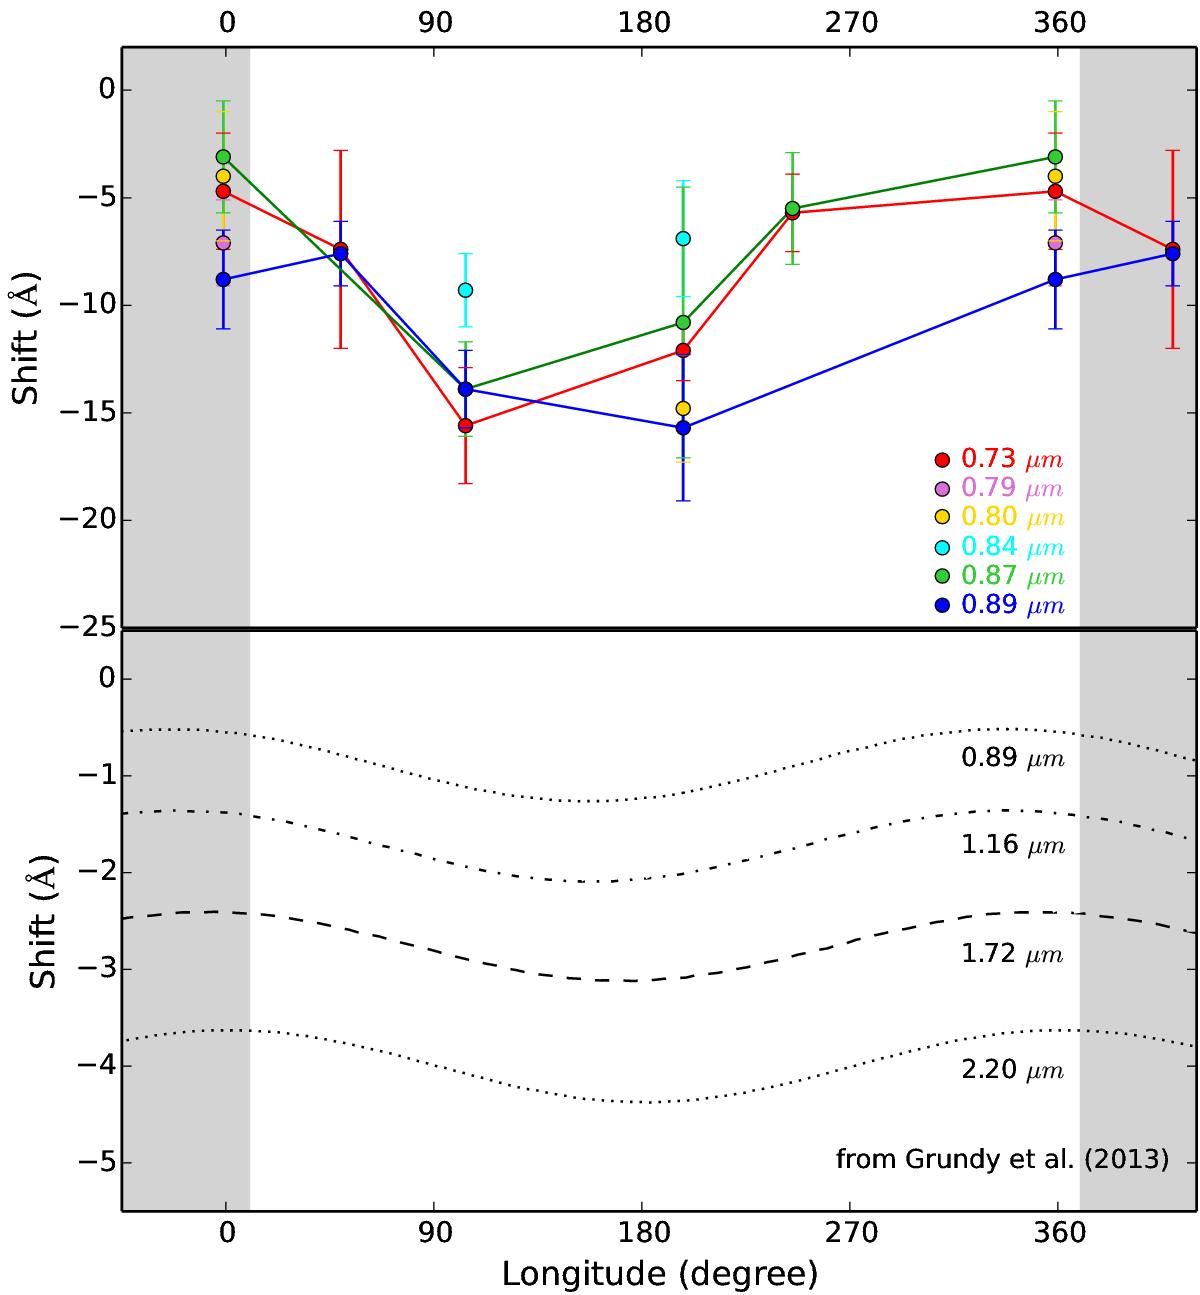
Top panel: measured band shifts (Å), with respect to the position of the pure methane from this work vs. Pluto’s longitude. We connected the points corresponding to the bands at 0.73, 0.87, and 0.89 μm with lines to illustrate the variation with longitude (for the other bands, there are too few points). At longitudes between 100° and 200°, the shifts are greater, thus the CH4:N2 is smaller, which is compatible with a lower abundance of CH4 suggested by the smaller band depths shown in Fig. 8. Bottom panel: variation in the shifts (Å) of the bands at 0.89, 1.16, 1.72, and 2.20 μm with respect to the position of the pure methane, from G13. The points in the gray shadow represent replicate values (at longitude ±360°) to better visualize the variation in the band depth with the longitude.
Current usage metrics show cumulative count of Article Views (full-text article views including HTML views, PDF and ePub downloads, according to the available data) and Abstracts Views on Vision4Press platform.
Data correspond to usage on the plateform after 2015. The current usage metrics is available 48-96 hours after online publication and is updated daily on week days.
Initial download of the metrics may take a while.