Fig. 7
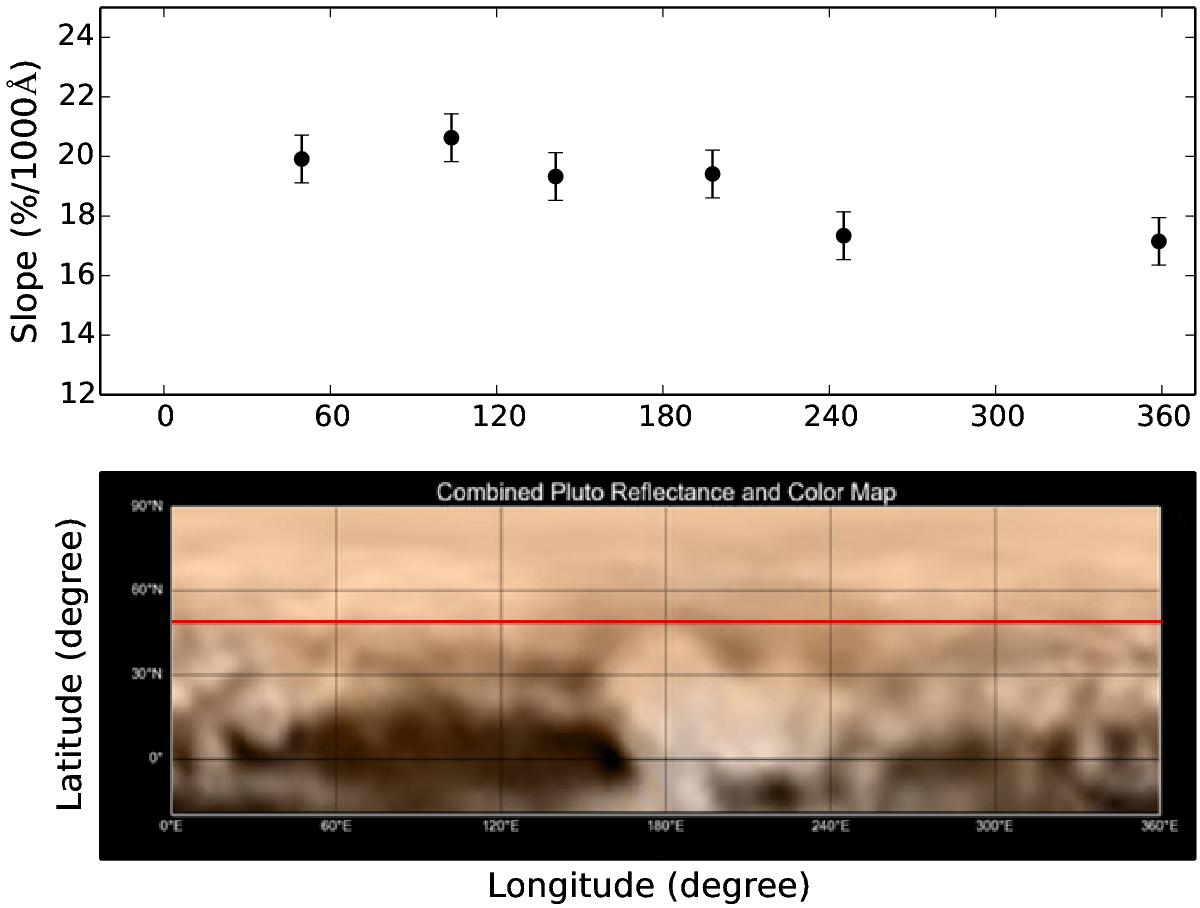
Spectral slope (% / 1000 Å), calculated between 0.40 and 0.75 μm for spectra of Pluto normalized at 0.60 μm vs. longitudes (top panel), and map of part of the surface of Pluto result of combination of images taken by the Long Range Reconnaissance Imager (LORRI) on New Horizons and combined with the lower-resolution color data from the instrument Ralph on the spacecraft (bottom panel) (http://www.nasa.gov/mission_pages/newhorizons). The scale of the horizontal axis is the same for the top and bottom panels. The red line indicates the sub-Earth latitude at which our data have been obtained (~51°).
Current usage metrics show cumulative count of Article Views (full-text article views including HTML views, PDF and ePub downloads, according to the available data) and Abstracts Views on Vision4Press platform.
Data correspond to usage on the plateform after 2015. The current usage metrics is available 48-96 hours after online publication and is updated daily on week days.
Initial download of the metrics may take a while.