Fig. 3
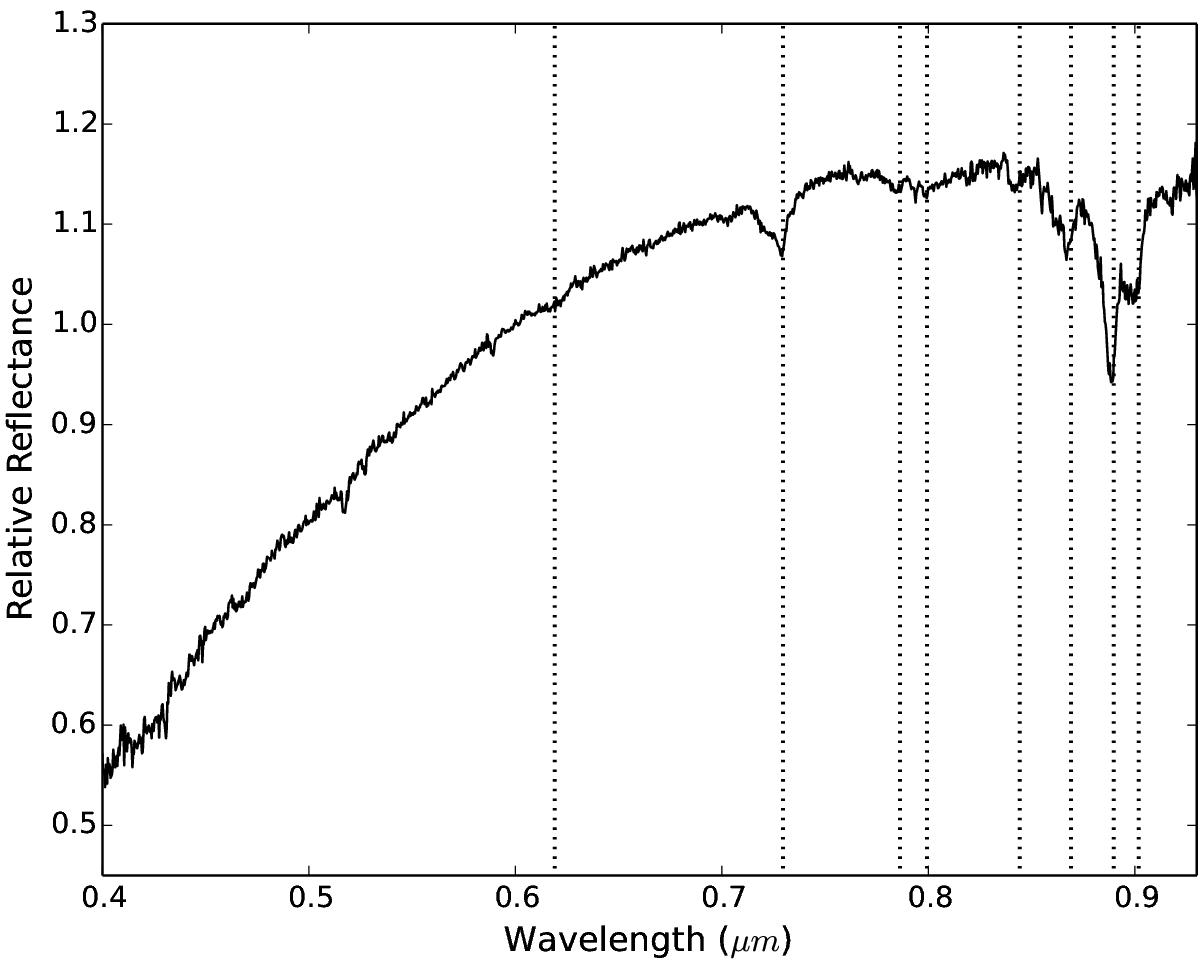
Averaged spectrum of the six spectrum presented in this work, normalized at 0.60 μm. The positions of the absorption bands of CH4 are represented by dotted lines. The features at 0.43, 0.52, and 0.59 μm are artifacts due to small differences between the spectra of the G2 stars used as solar analogs and those of the Sun. The 0.43 μm structure corresponds to the absorption produced by iron and calcium, the 0.52 μm is due to the magnesium triplet, and the 0.59 μm is due to a sodium doublet.
Current usage metrics show cumulative count of Article Views (full-text article views including HTML views, PDF and ePub downloads, according to the available data) and Abstracts Views on Vision4Press platform.
Data correspond to usage on the plateform after 2015. The current usage metrics is available 48-96 hours after online publication and is updated daily on week days.
Initial download of the metrics may take a while.