Fig. 11
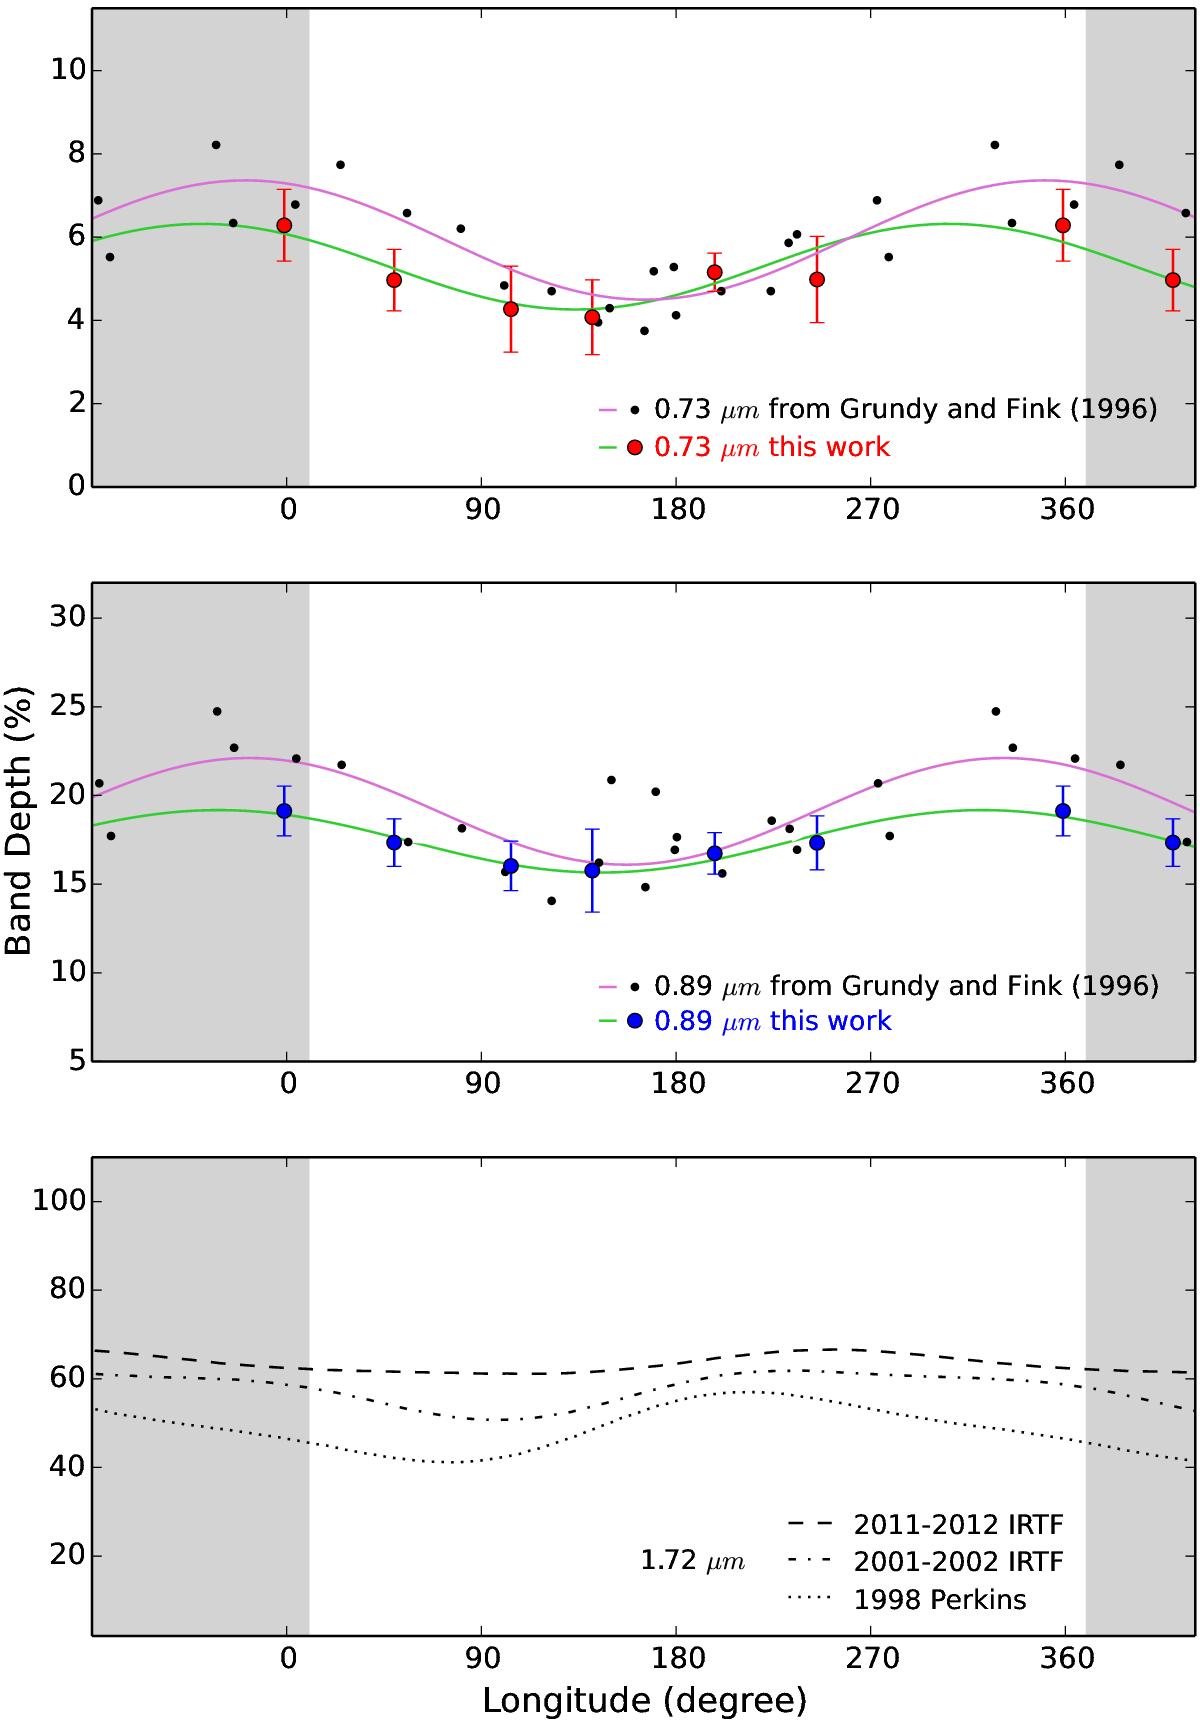
Secular trend of the methane absorption bands: variation in the absorption band depth for the bands at 0.73 μm (top panel) and 0.89 μm (middle panel) compared with the secular variation for the band at 1.72 μm (bottom panel) from G13. Lines in green represent a sinusoidal fit of band depths from this work; lines in purple represent a sinusoidal fit of band depths from Grundy & Fink (1996). The points in the gray shadow represent replicate values (at longitude 360°) to better visualize the variation in the shifts with the longitude.
Current usage metrics show cumulative count of Article Views (full-text article views including HTML views, PDF and ePub downloads, according to the available data) and Abstracts Views on Vision4Press platform.
Data correspond to usage on the plateform after 2015. The current usage metrics is available 48-96 hours after online publication and is updated daily on week days.
Initial download of the metrics may take a while.