Fig. 8
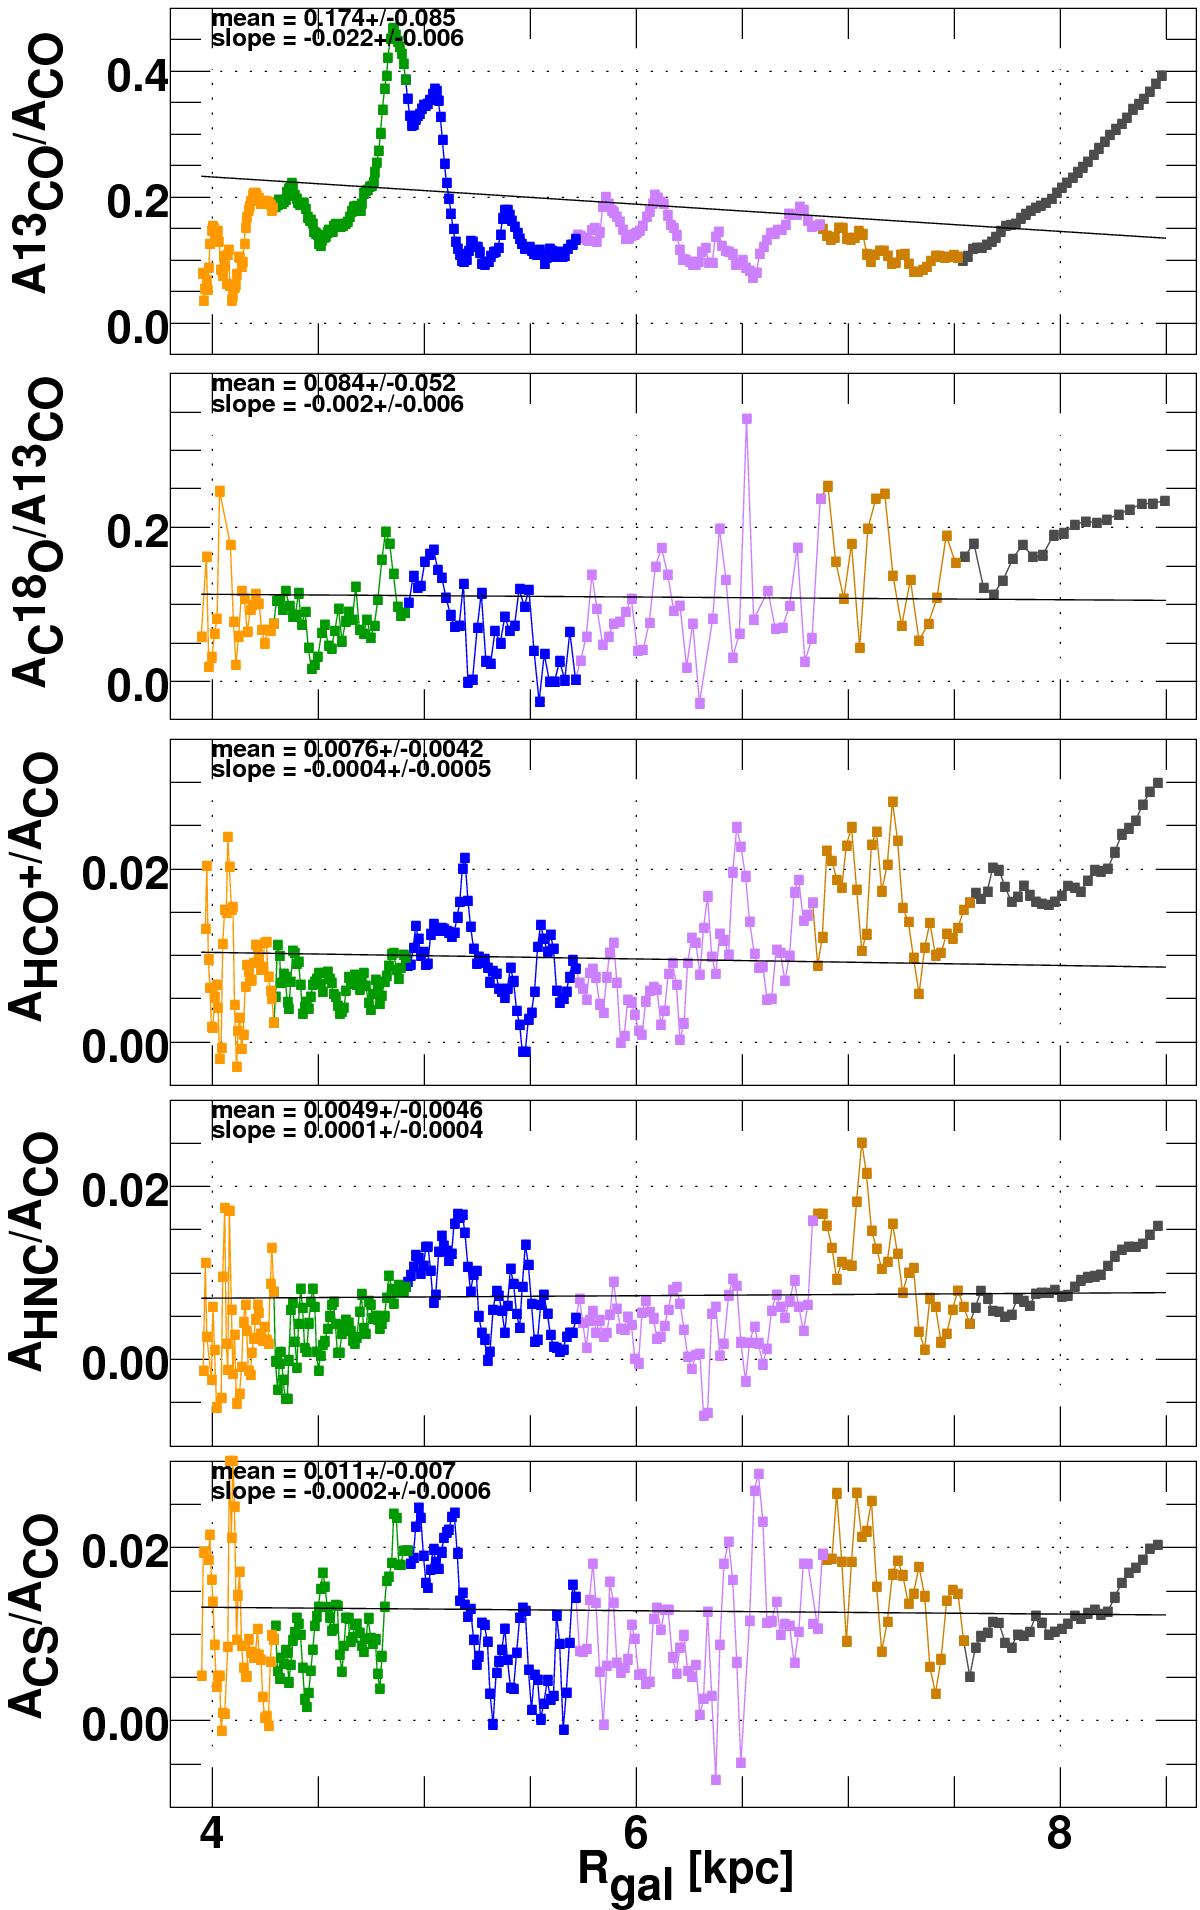
Ratios of emission from ![]() , HCO+, HNC, and CS(2−1) relative to CO, and C18O relative to
, HCO+, HNC, and CS(2−1) relative to CO, and C18O relative to ![]() . The regression lines were fit to the data at R ≤ 6.6 kpc (R ≤ 6.3 kpc for HCO+) to avoid contamination from the W31 complex at V ≤ 10 km s-1 that appears as a false excess of emission at larger galactocentric radii for species with higher dipole moments. The mean ratios ± 1σ and slopes of the fitted regression lines are shown in the individual panels.
. The regression lines were fit to the data at R ≤ 6.6 kpc (R ≤ 6.3 kpc for HCO+) to avoid contamination from the W31 complex at V ≤ 10 km s-1 that appears as a false excess of emission at larger galactocentric radii for species with higher dipole moments. The mean ratios ± 1σ and slopes of the fitted regression lines are shown in the individual panels.
Current usage metrics show cumulative count of Article Views (full-text article views including HTML views, PDF and ePub downloads, according to the available data) and Abstracts Views on Vision4Press platform.
Data correspond to usage on the plateform after 2015. The current usage metrics is available 48-96 hours after online publication and is updated daily on week days.
Initial download of the metrics may take a while.