Fig. 7
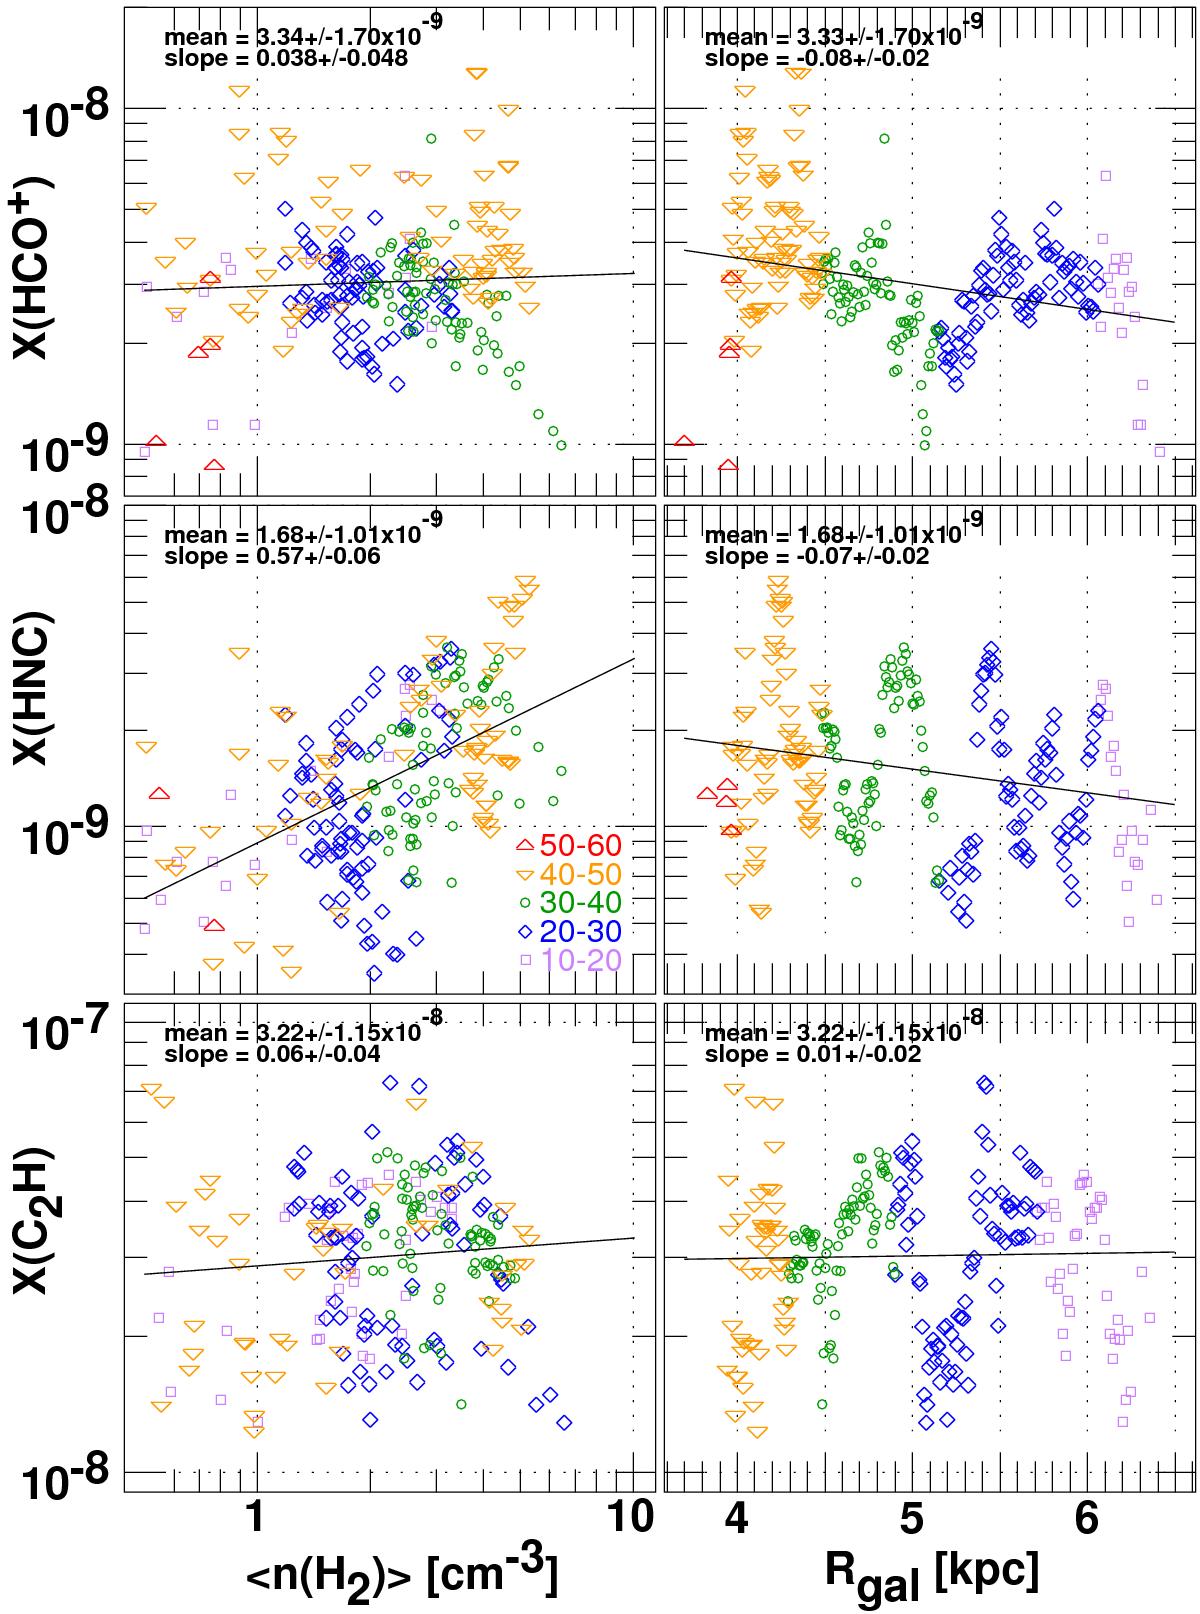
Relative abundances of HCO+, HNC, and C2H observed in absorption with respect to H2 plotted against the local spaced-averaged mean H2 density derived from CH (at left) and galactocentric radius (at right). Column and number densities of H2 were derived from the CH absorption profile as discussed in Sect. 4 of the text. The mean relative abundances ± 1σ and power-law slopes of the fitted regression lines are shown in the individual panels.
Current usage metrics show cumulative count of Article Views (full-text article views including HTML views, PDF and ePub downloads, according to the available data) and Abstracts Views on Vision4Press platform.
Data correspond to usage on the plateform after 2015. The current usage metrics is available 48-96 hours after online publication and is updated daily on week days.
Initial download of the metrics may take a while.