Fig. 6
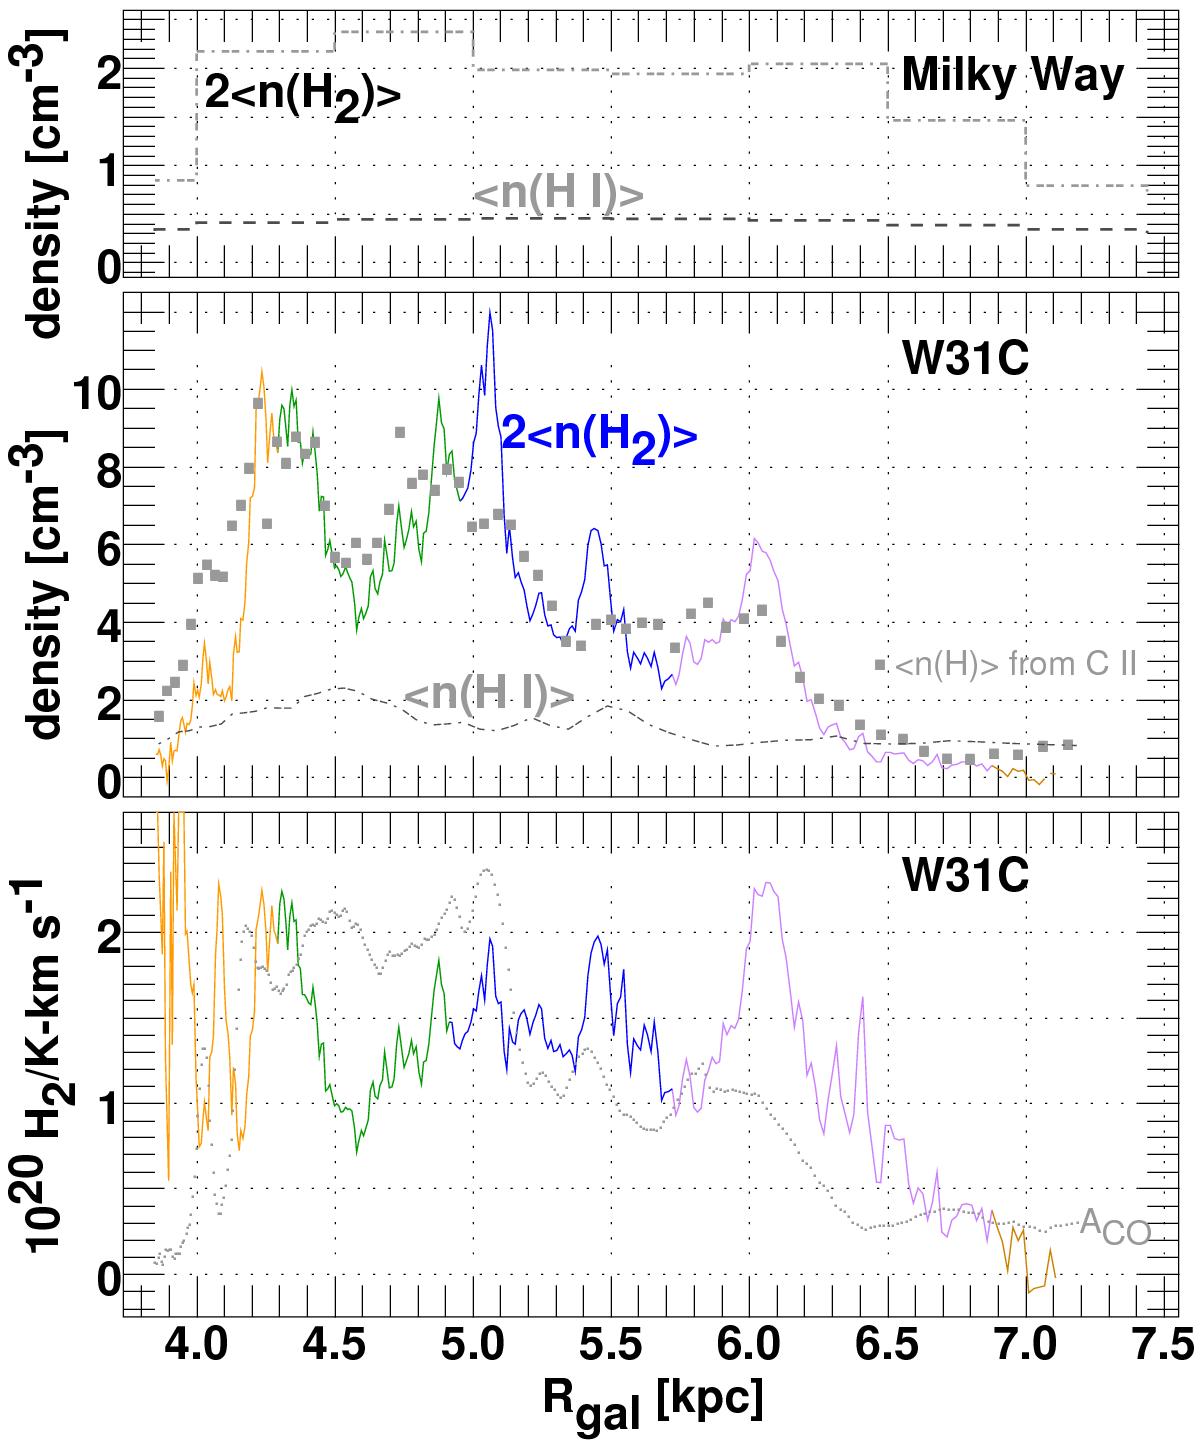
Top: Milky Way space-averaged mean atomic and molecular densities from Pineda et al. (2013). Middle: mean densities 2⟨ n(H2)⟩ derived from CH absorption with X(CH) = 3.5 × 10⁻⁸ shown as a solid line, color coded as in previous figures); ⟨ n(H)⟩ derived from C II absorption using n(C+)/n(H) = 1.4 × 10⁻⁴ (filled light gray rectangles); and n(H I) derived from from a nearby NGPS survey H I emission profile assuming a constant spin temperature of 135 K, shown as a dashed gray line. Bottom: the CO-H2 conversion factor derived by dividing the mean molecular density ⟨ n(H2)⟩ by the CO abundance ACO assuming that the CO-emitting gas is on the near side. The histogram of ACO is overlaid and heavily shaded with an arbitrary vertical scale in the bottom panel.
Current usage metrics show cumulative count of Article Views (full-text article views including HTML views, PDF and ePub downloads, according to the available data) and Abstracts Views on Vision4Press platform.
Data correspond to usage on the plateform after 2015. The current usage metrics is available 48-96 hours after online publication and is updated daily on week days.
Initial download of the metrics may take a while.