Fig. 5
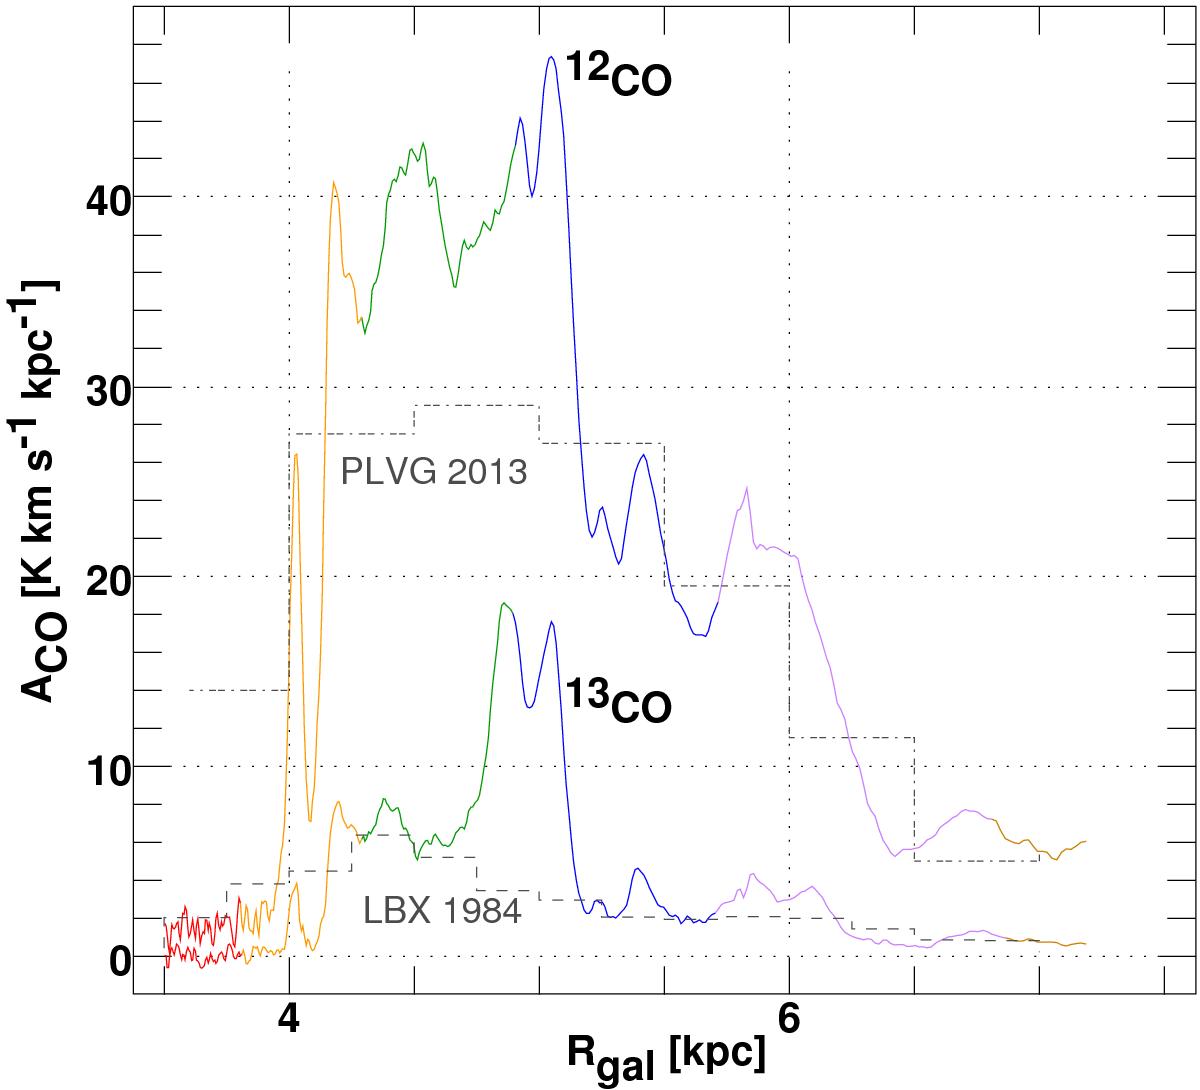
Galactic abundance of CO and ![]() emission vs. galactocentric distance for a flat rotation curve with R0 = 8.5 kpc and Θ0 = 220 km s-1. The dashed histogram of the
emission vs. galactocentric distance for a flat rotation curve with R0 = 8.5 kpc and Θ0 = 220 km s-1. The dashed histogram of the ![]() abundance labeled LBX 1984 is from a re-analysis of the
abundance labeled LBX 1984 is from a re-analysis of the ![]() survey data of Liszt et al. (1984) and the dash-dotted histogram for CO labeled PLVG 2013 was transcribed from Fig. 7 of Pineda et al. (2013). The color coding is as in previous figures.
survey data of Liszt et al. (1984) and the dash-dotted histogram for CO labeled PLVG 2013 was transcribed from Fig. 7 of Pineda et al. (2013). The color coding is as in previous figures.
Current usage metrics show cumulative count of Article Views (full-text article views including HTML views, PDF and ePub downloads, according to the available data) and Abstracts Views on Vision4Press platform.
Data correspond to usage on the plateform after 2015. The current usage metrics is available 48-96 hours after online publication and is updated daily on week days.
Initial download of the metrics may take a while.