Fig. 3
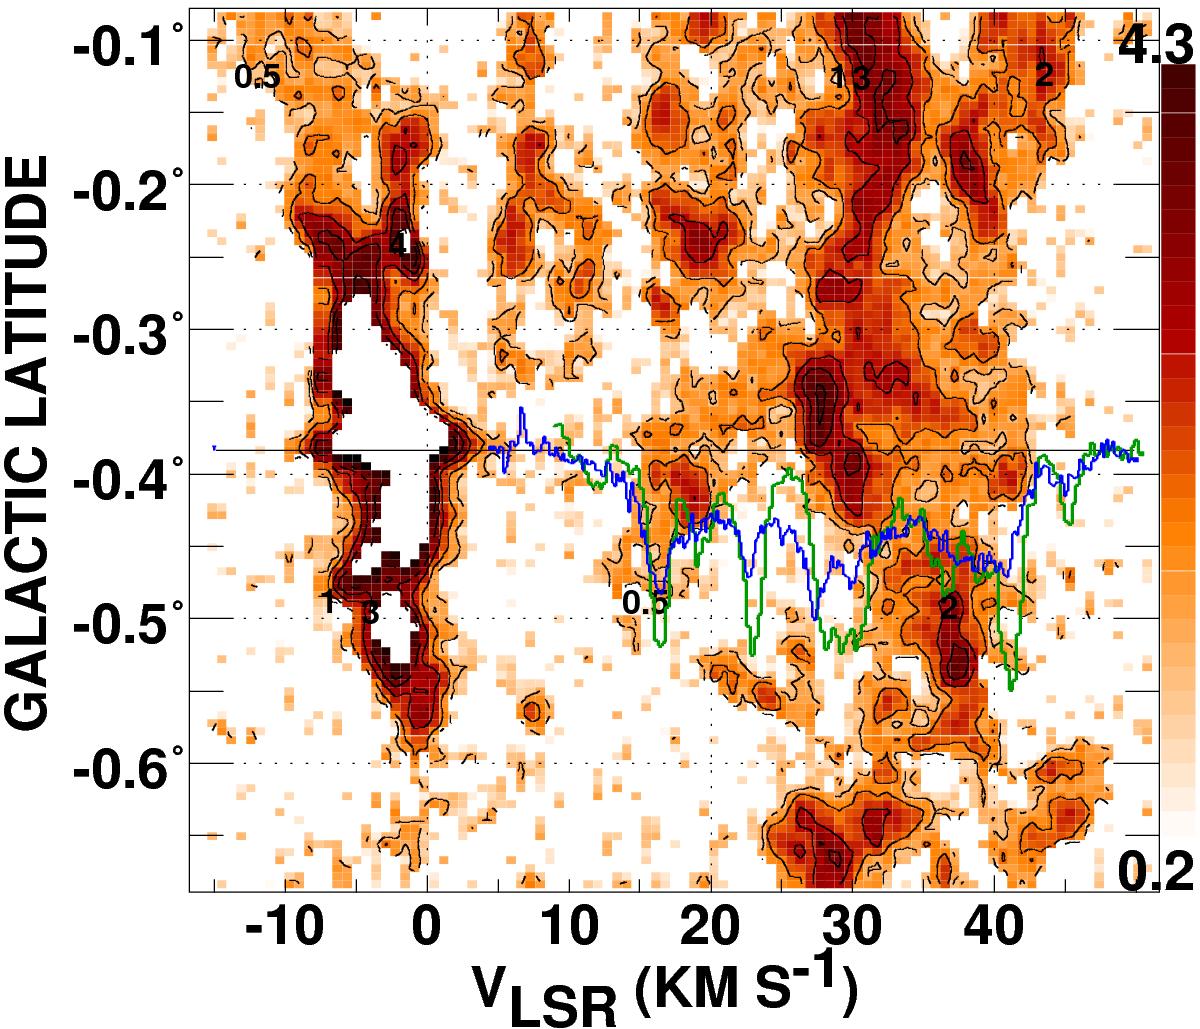
Latitude-velocity diagram of ![]() emission through the position of W31C G10.62-0.38 at 1′ resolution from the ARO 12m telescope. The
emission through the position of W31C G10.62-0.38 at 1′ resolution from the ARO 12m telescope. The ![]() brightness scale is indicated at the right, running from 0.2 to 4.3 K. The HNC absorption profile of Godard et al. (2010) is shown overlaid in green with its zero-level at the latitude of W31; the CH absorption profile is overlaid in blue (see also Fig. 2).
brightness scale is indicated at the right, running from 0.2 to 4.3 K. The HNC absorption profile of Godard et al. (2010) is shown overlaid in green with its zero-level at the latitude of W31; the CH absorption profile is overlaid in blue (see also Fig. 2).
Current usage metrics show cumulative count of Article Views (full-text article views including HTML views, PDF and ePub downloads, according to the available data) and Abstracts Views on Vision4Press platform.
Data correspond to usage on the plateform after 2015. The current usage metrics is available 48-96 hours after online publication and is updated daily on week days.
Initial download of the metrics may take a while.