Fig. 4
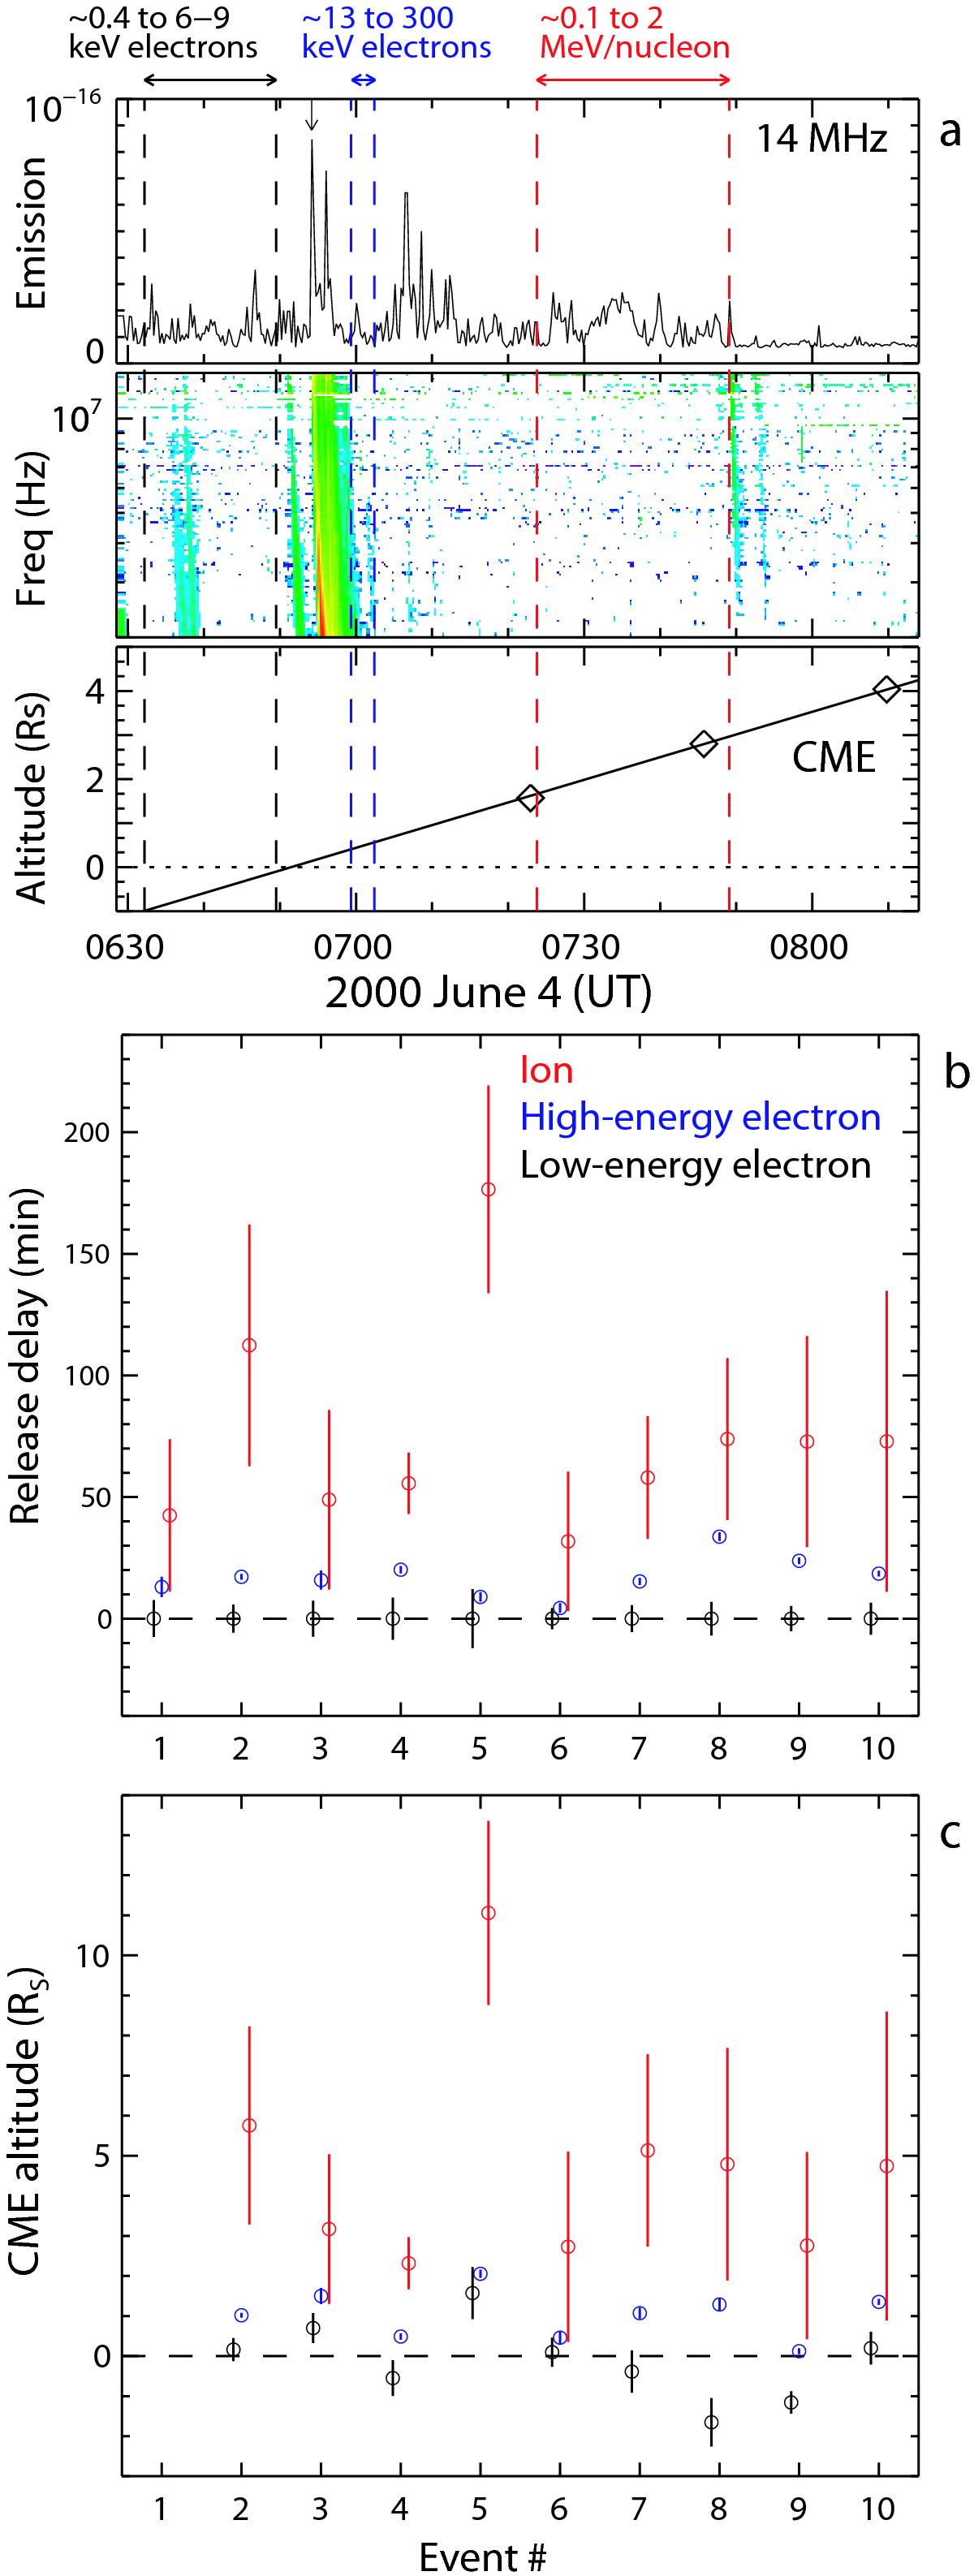
Panel a): temporal comparison for event #4. Top: radio emission intensity measured at ~14 MHz by WIND/WAVES, with the black vertical arrow indicating the time of maximum emission. Middle: dynamic radio spectrogram at decametric to hectometric wavelengths. Bottom: CME altitude above the photosphere measured by SOHO/LASCO. The shown radio and CME data have been shifted back by the photon travel time of 500 s from the Sun to Earth. Panel b): particle injection delays after the start of low-energy electron injection for the ten events. Panel c): projected CME altitudes above the photosphere (horizontal dashed line) at the start of particle injections. Vertical dashed lines in a) and circles (with error bars) in b) and c) indicate the start-time range of inferred solar injections for low-energy electrons (black), high-energy electrons (blue) and carbon and heavier ions (red).
Current usage metrics show cumulative count of Article Views (full-text article views including HTML views, PDF and ePub downloads, according to the available data) and Abstracts Views on Vision4Press platform.
Data correspond to usage on the plateform after 2015. The current usage metrics is available 48-96 hours after online publication and is updated daily on week days.
Initial download of the metrics may take a while.