Fig. 3
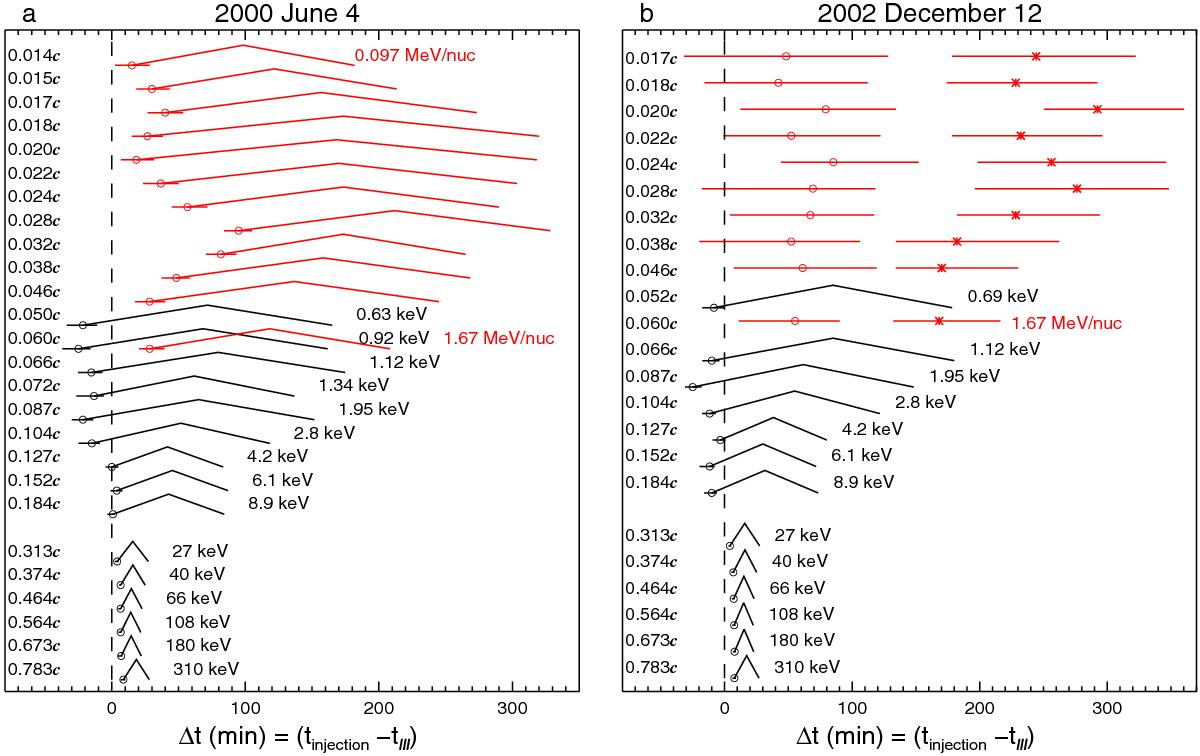
Inferred solar injection timing of electrons (black) and ions (carbon and heavier, red) for event #4 a) and #10 b). The x axis shows the time in minutes, with respect to the estimated coronal release time of type III radio bursts (dashed line at Δt = 0). The triangular profiles indicate the time variation of particle injections in intensity. The circles indicate the start time of particle injections. In panel b), the asterisks represent the peak time of ion injections. The labels indicate the energy or the velocity in terms of speed of light c, for different energy channels.
Current usage metrics show cumulative count of Article Views (full-text article views including HTML views, PDF and ePub downloads, according to the available data) and Abstracts Views on Vision4Press platform.
Data correspond to usage on the plateform after 2015. The current usage metrics is available 48-96 hours after online publication and is updated daily on week days.
Initial download of the metrics may take a while.