Fig. 1
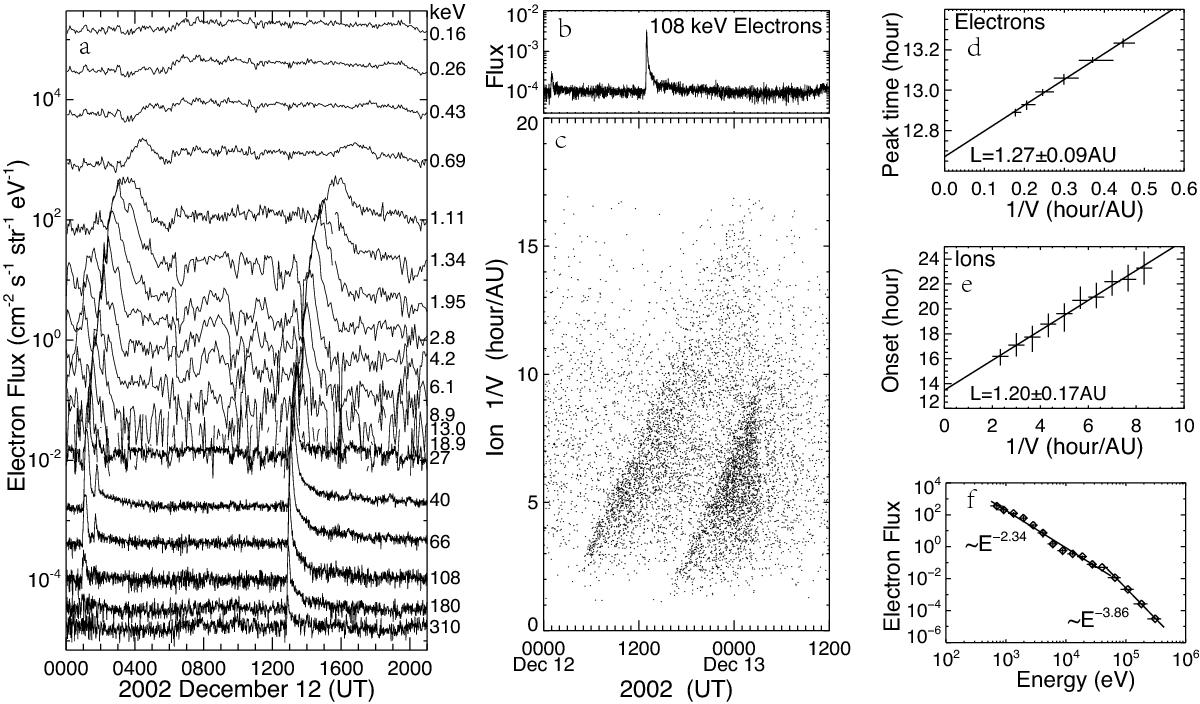
Overview plot for event #9 and 10. a) The flux vs. time of electrons travelling outward from the Sun observed by WIND/3DP on December 12, 2002. The labels indicate the channel center energies. b) The flux-time profile of the outward traveling electrons at 108 keV. c) The ion spectrogram of 1/speed vs. arrival time for 10−70 amu ions measured by ACE/ULEIS on December 12−13, 2002. d) The velocity dispersion analysis of the observed times of the electron peak flux at energies above 25 keV for event #10. e) The same analysis, but for the onset times of carbon and heavier ions. f) The electron energy spectrum of background-subtracted peak flux for event #10. In d)−e), the straight lines represent the least-squares fit to the data points.
Current usage metrics show cumulative count of Article Views (full-text article views including HTML views, PDF and ePub downloads, according to the available data) and Abstracts Views on Vision4Press platform.
Data correspond to usage on the plateform after 2015. The current usage metrics is available 48-96 hours after online publication and is updated daily on week days.
Initial download of the metrics may take a while.