Fig. 8
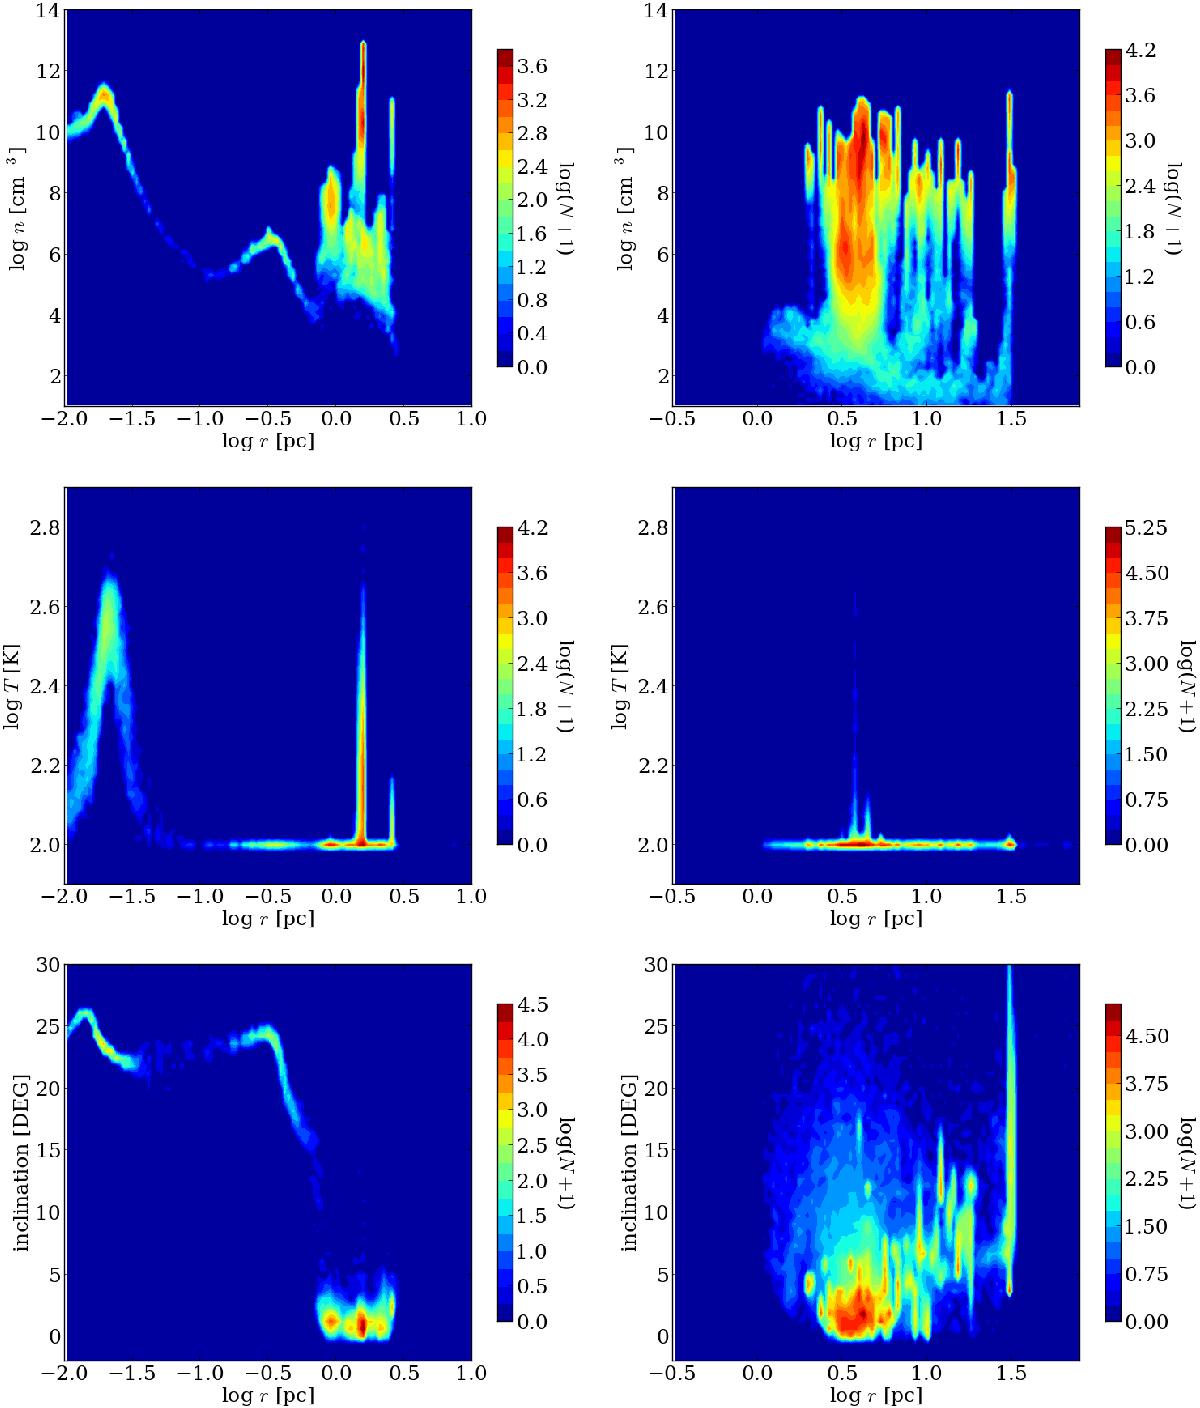
Contour-plot of the number density (top panels), temperature (middle panels), and inclination (bottom panels) of gas particles as a function of the distance from the SMBH in runs R1 (left panels) and R6 (right panels) at t = 2 Myr. The inclination is measured with respect to the direction of the total angular momentum vector of the simulated gas at t = 2 Myr. The colour-map is in logarithmic scale and represents the number of gas particles (N) per each cell of the contour-plot.
Current usage metrics show cumulative count of Article Views (full-text article views including HTML views, PDF and ePub downloads, according to the available data) and Abstracts Views on Vision4Press platform.
Data correspond to usage on the plateform after 2015. The current usage metrics is available 48-96 hours after online publication and is updated daily on week days.
Initial download of the metrics may take a while.