Fig. 3
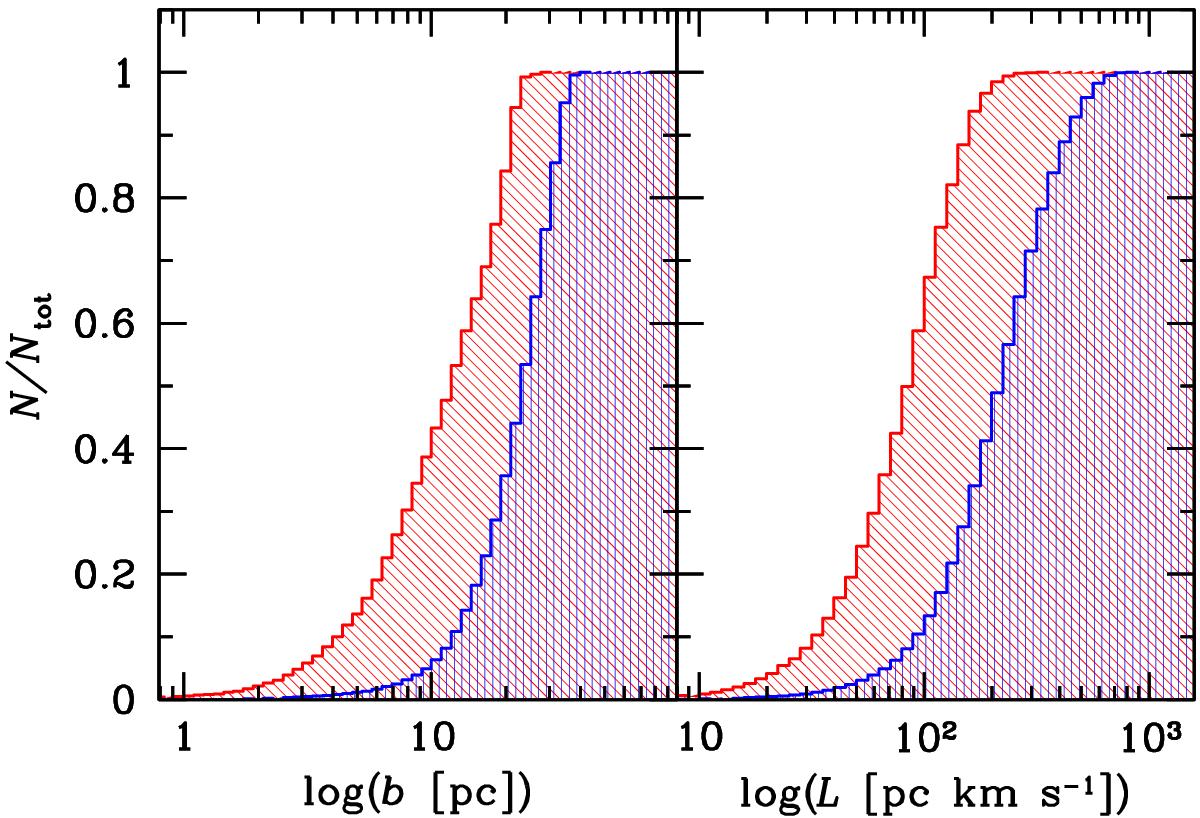
Cumulative distribution of impact parameter b (left panel) and specific angular momentum L (right panel) of gas particles in the initial conditions of run R1. Blue vertically hatched histogram: all gas particles in the simulations. Red diagonally hatched histogram: gas particles that will become members of the inner ring at time ≤2.5 × 10⁵ yr. Both histograms are normalized to the total number of elements in the cumulative distribution (10655 and 107783 particles in the red and blue histogram, respectively).
Current usage metrics show cumulative count of Article Views (full-text article views including HTML views, PDF and ePub downloads, according to the available data) and Abstracts Views on Vision4Press platform.
Data correspond to usage on the plateform after 2015. The current usage metrics is available 48-96 hours after online publication and is updated daily on week days.
Initial download of the metrics may take a while.