Fig. 1
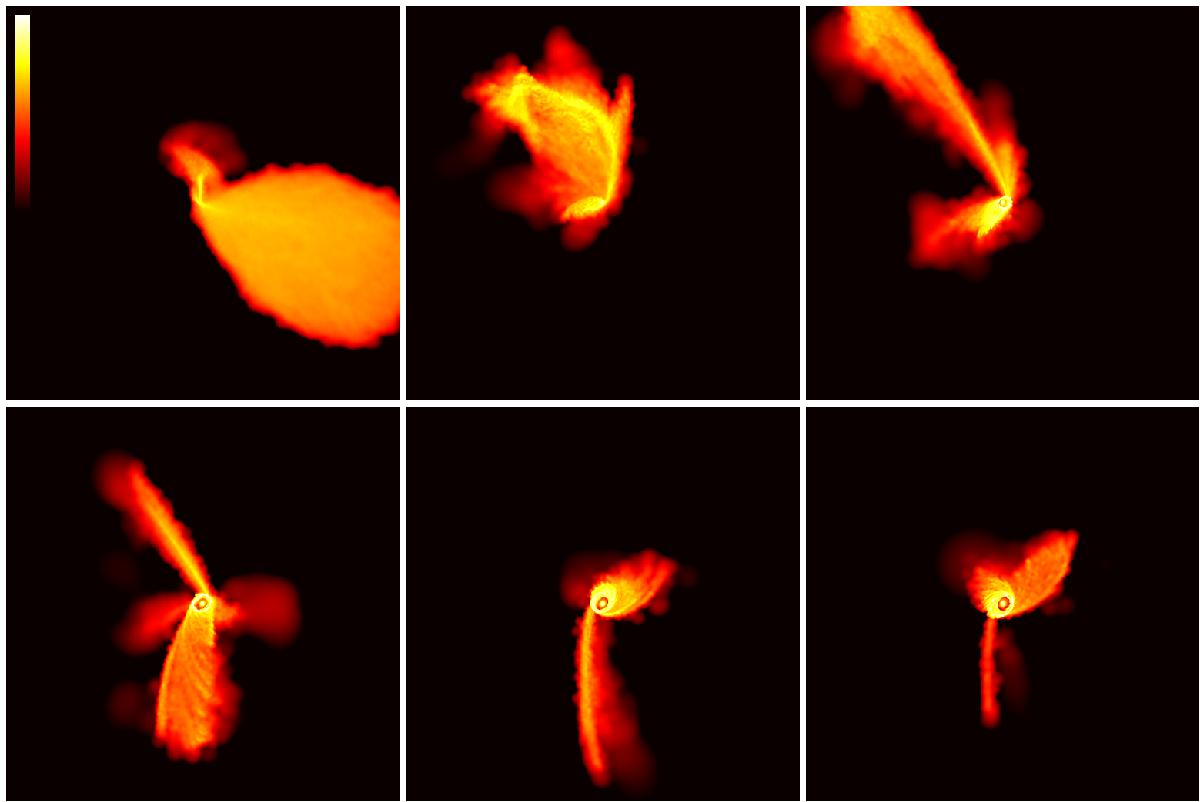
Colour-coded density map of gas in run R1 showing the yz-plane of the simulation. The density map is smoothed over the smoothing length of single particles. From top to bottom and from left to right: t = 1.5, 3.5, 5.5, 7.5, 9.5, and 10.5 × 10⁵ yr. Each panel measures 50 pc per edge. The colourbar ranges from 7× 10⁻⁵ to 70 M⊙ pc-3.
Current usage metrics show cumulative count of Article Views (full-text article views including HTML views, PDF and ePub downloads, according to the available data) and Abstracts Views on Vision4Press platform.
Data correspond to usage on the plateform after 2015. The current usage metrics is available 48-96 hours after online publication and is updated daily on week days.
Initial download of the metrics may take a while.