Fig. 9
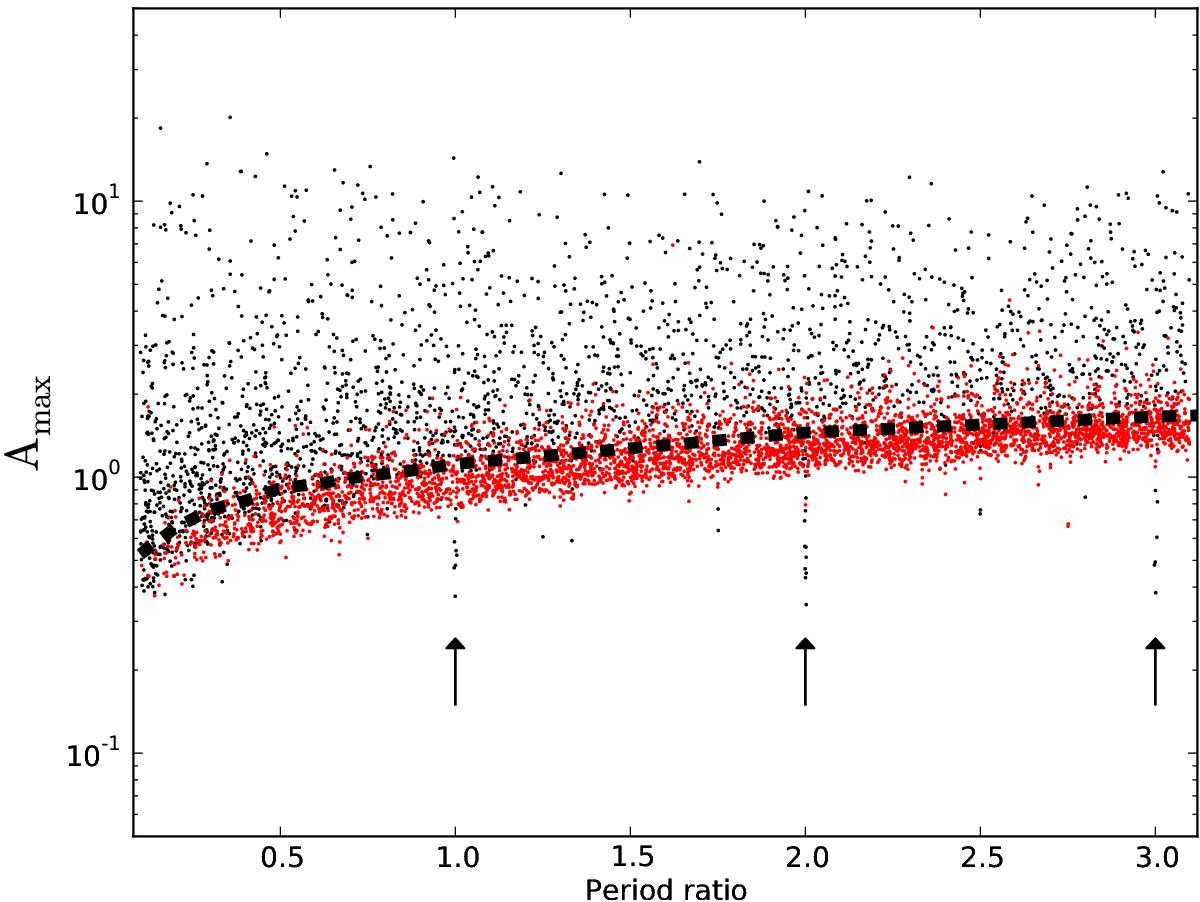
Amplitude of the TTV measurements over the period ratio for all individual simulations. The red points indicate all simulations for which the determined period has a FAP < 10-3, which are the simulations with high TSNRs (see Fig. 8). The black dashed line indicates the maximum amplitude values given by Fig. 5. The arrows indicate the localized drops in amplitudes at integer period ratios (see Sect. 5.2).
Current usage metrics show cumulative count of Article Views (full-text article views including HTML views, PDF and ePub downloads, according to the available data) and Abstracts Views on Vision4Press platform.
Data correspond to usage on the plateform after 2015. The current usage metrics is available 48-96 hours after online publication and is updated daily on week days.
Initial download of the metrics may take a while.