Free Access
Fig. 2
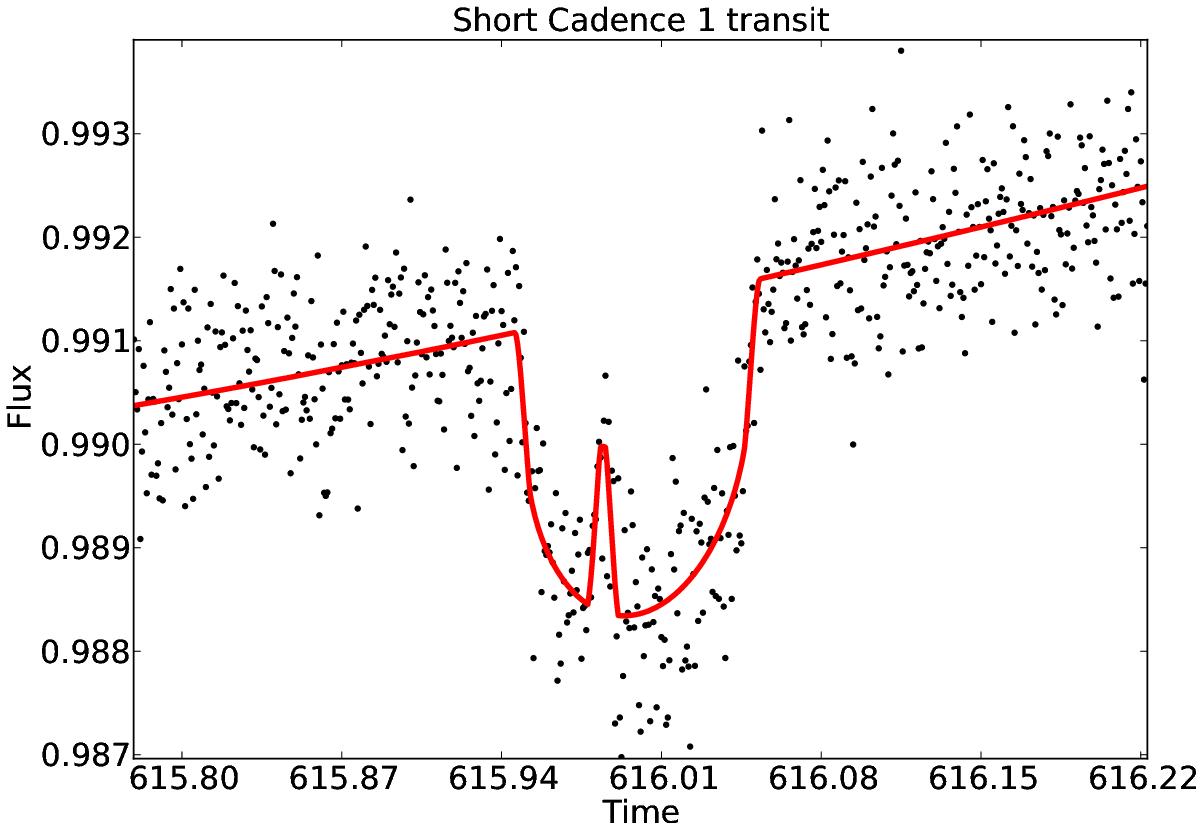
Simulated transit of a Neptune-sized planet. The red line represents the infinite signal-to-noise data, while the noise of the black dots is similar to that of Kepler short cadence data. During the transit there is a spot-crossing event right after the ingress.
Current usage metrics show cumulative count of Article Views (full-text article views including HTML views, PDF and ePub downloads, according to the available data) and Abstracts Views on Vision4Press platform.
Data correspond to usage on the plateform after 2015. The current usage metrics is available 48-96 hours after online publication and is updated daily on week days.
Initial download of the metrics may take a while.