Free Access
Fig. 10
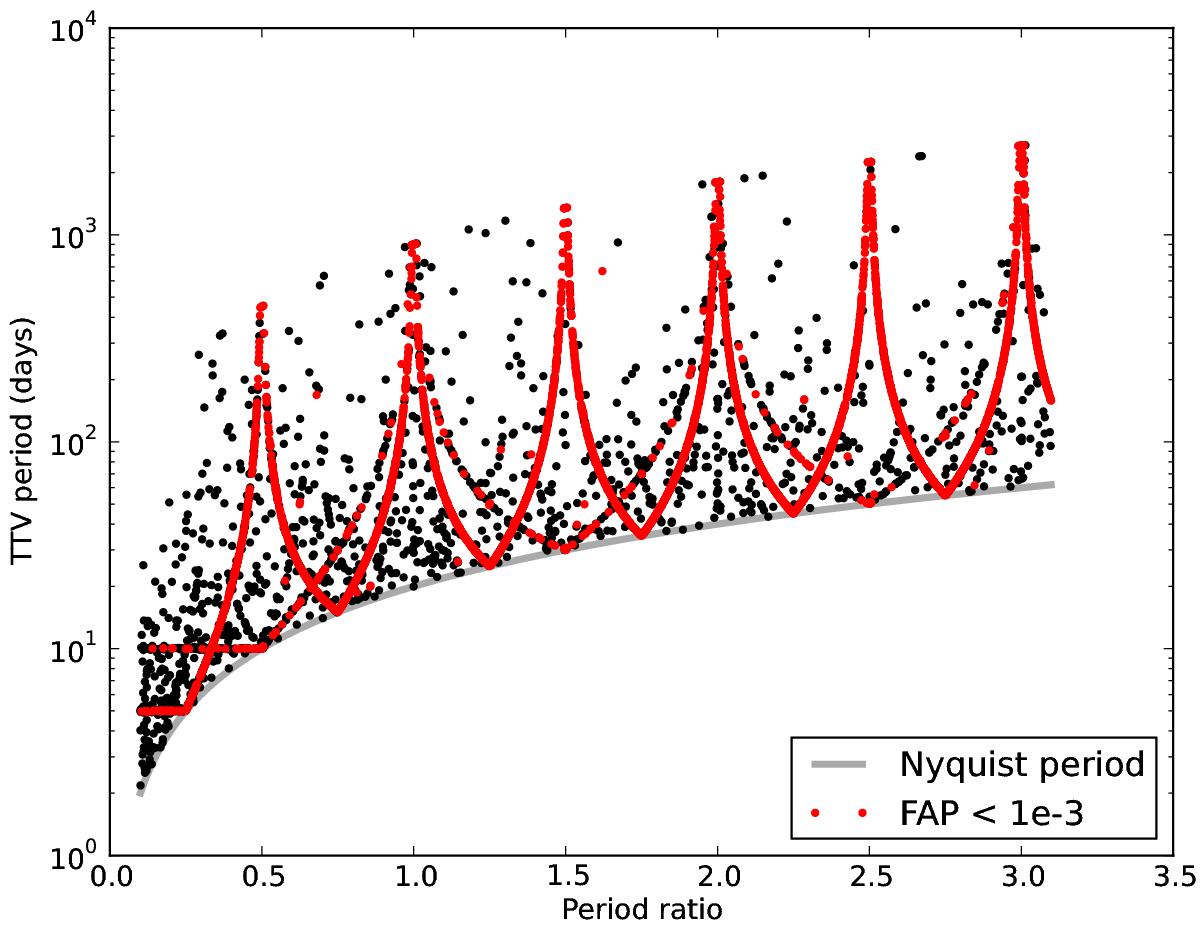
For each individual simulaiton, the most significant period is determined from the TTVs over the input period ratio. The gray line indicates the lower limit of possible periods defined by the Nyquist frequency. The red points indicate periods with FAP < 10-3.
Current usage metrics show cumulative count of Article Views (full-text article views including HTML views, PDF and ePub downloads, according to the available data) and Abstracts Views on Vision4Press platform.
Data correspond to usage on the plateform after 2015. The current usage metrics is available 48-96 hours after online publication and is updated daily on week days.
Initial download of the metrics may take a while.