Fig. 3
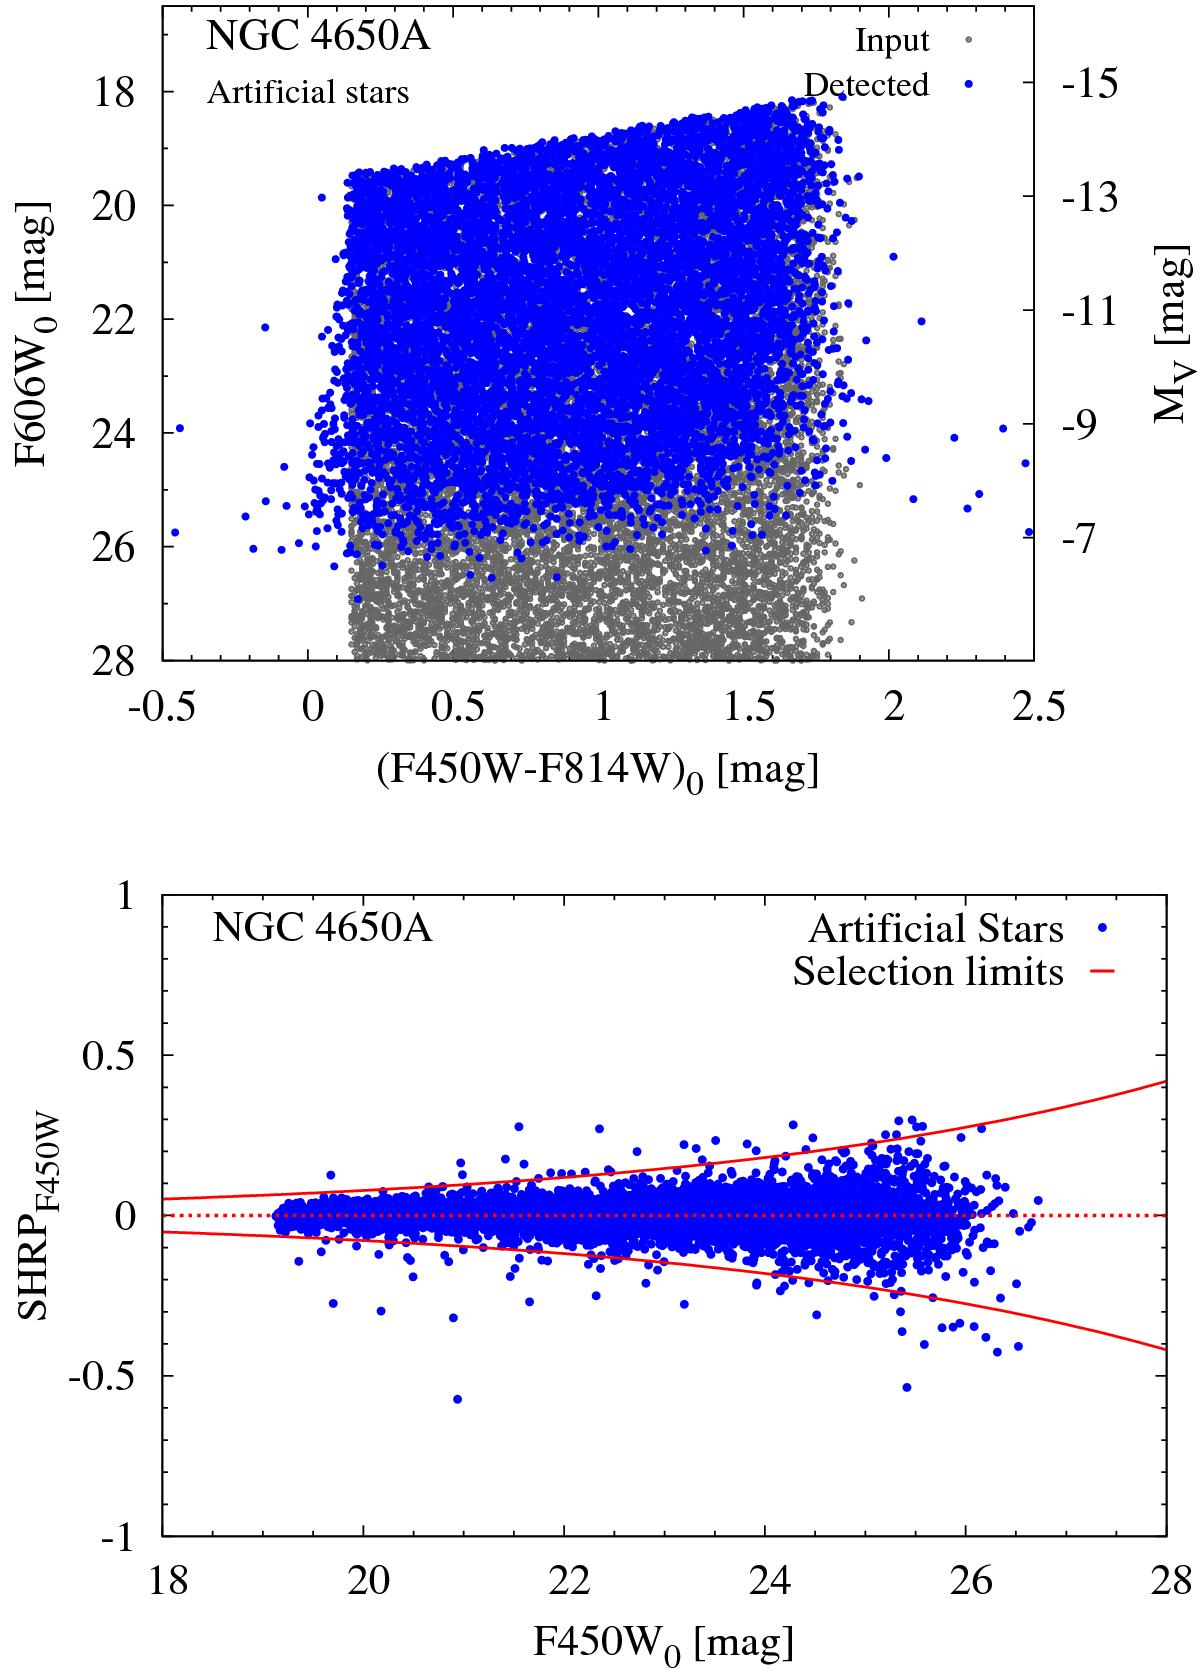
Artificial star tests for the case of NGC 4650A. The same analysis is performed for NGC 3808. Top panel: color−magnitude diagram of input (gray dots) and recovered (dark blue solid dots) artificial stars. Bottom panel: artificial stars’s sharpness value against their F450W-band magnitude. Red solid curve indicates the exponential cuts used for selecting unresolved objects (see Sect. 2.7).
Current usage metrics show cumulative count of Article Views (full-text article views including HTML views, PDF and ePub downloads, according to the available data) and Abstracts Views on Vision4Press platform.
Data correspond to usage on the plateform after 2015. The current usage metrics is available 48-96 hours after online publication and is updated daily on week days.
Initial download of the metrics may take a while.