Fig. 6
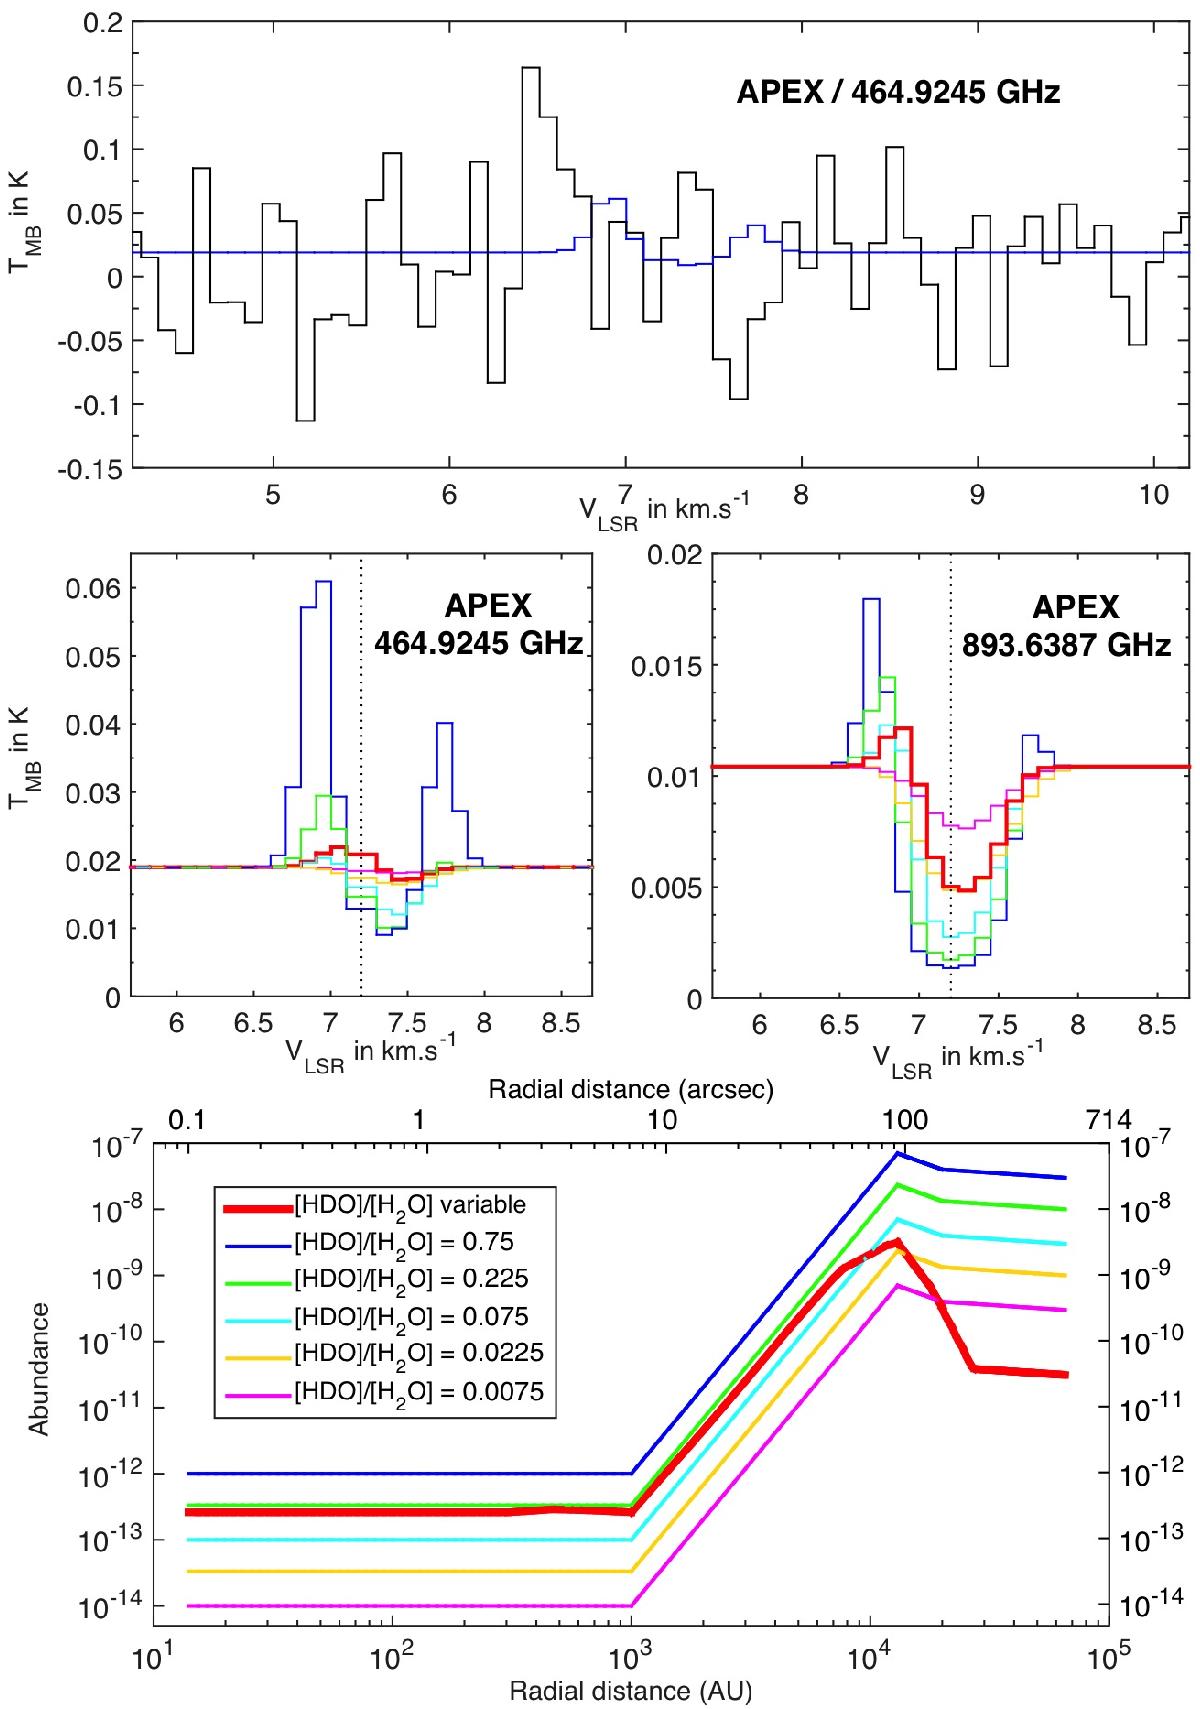
Top panel: HDO 10,1–00,0 line profile of the D/H = 1 model (in blue) versus APEX observation (in black). Middle panels: HDO 10,1–00,0 (left panel) and 11,1–00,0 (right panel) line profiles for the six different D/H ratios. Bottom panel: HDO abundance profiles as a function of the D/H ratio (see text, Sect. 5) used for these models as a function of the radial distance from the core in arcsec (top axis) and AU (bottom axis).
Current usage metrics show cumulative count of Article Views (full-text article views including HTML views, PDF and ePub downloads, according to the available data) and Abstracts Views on Vision4Press platform.
Data correspond to usage on the plateform after 2015. The current usage metrics is available 48-96 hours after online publication and is updated daily on week days.
Initial download of the metrics may take a while.