Fig. 4
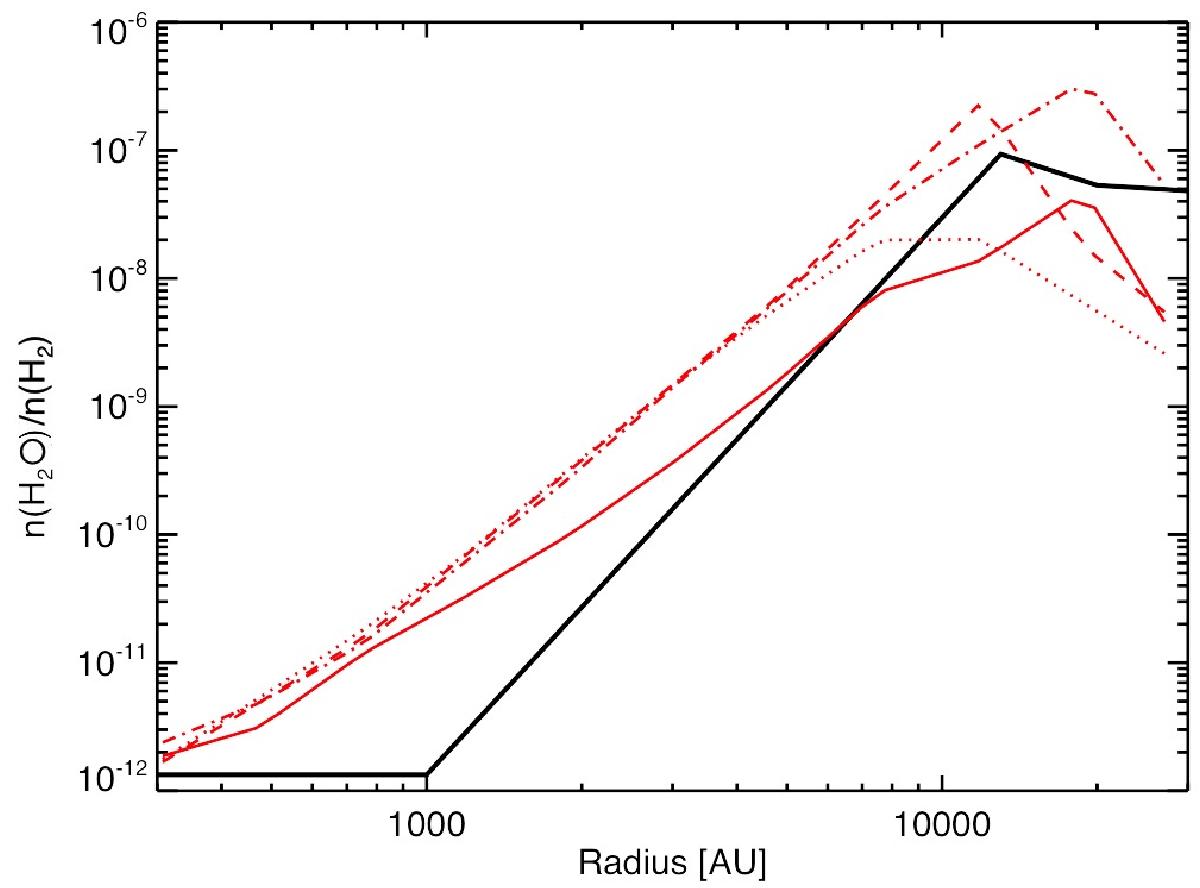
Water abundance profile in L1544 modelled with GRAINOBLE (red curves) compared with the observed profile based on LIME radiative transfer simulations (black). Dashed-dotted line: G0 = 1, AV,ext = 2, tc = 7.5 × 10⁵ yr; dashed line: G0 = 1, AV,ext = 1, tc = 7.5 × 10⁵ yr; dotted line: G0 = 0.1, AV,ext = 1, tc = 7.5 × 10⁵ yr; solid line: G0 = 1, AV,ext = 2, tc = 1.5 × 10⁶ yr.
Current usage metrics show cumulative count of Article Views (full-text article views including HTML views, PDF and ePub downloads, according to the available data) and Abstracts Views on Vision4Press platform.
Data correspond to usage on the plateform after 2015. The current usage metrics is available 48-96 hours after online publication and is updated daily on week days.
Initial download of the metrics may take a while.