Fig. 3
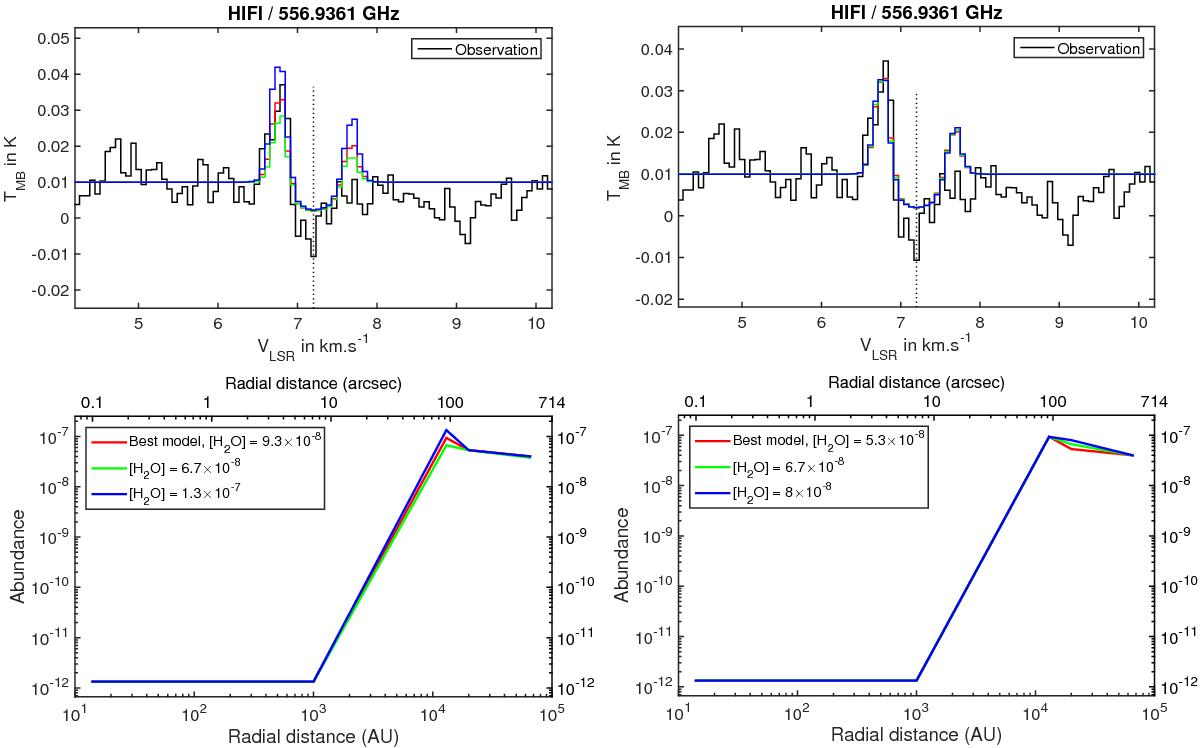
Top panels: line profile versus observation for three different modellings. The best fit model is shown in red. In the left panel, the abundance value at 13 000 AU varies between 6.7 × 10⁻⁸ and 1.3 × 10⁻⁷ and for the right panel, the abundance value at 20 000 AU varies between 5.3 × 10⁻⁸ and 8 × 10⁻⁸. Bottom panel: H2O abundance profile used for these respective models as a function of the radial distance from the core in arcsec (top axis) and AU (bottom axis).
Current usage metrics show cumulative count of Article Views (full-text article views including HTML views, PDF and ePub downloads, according to the available data) and Abstracts Views on Vision4Press platform.
Data correspond to usage on the plateform after 2015. The current usage metrics is available 48-96 hours after online publication and is updated daily on week days.
Initial download of the metrics may take a while.