Fig. 2
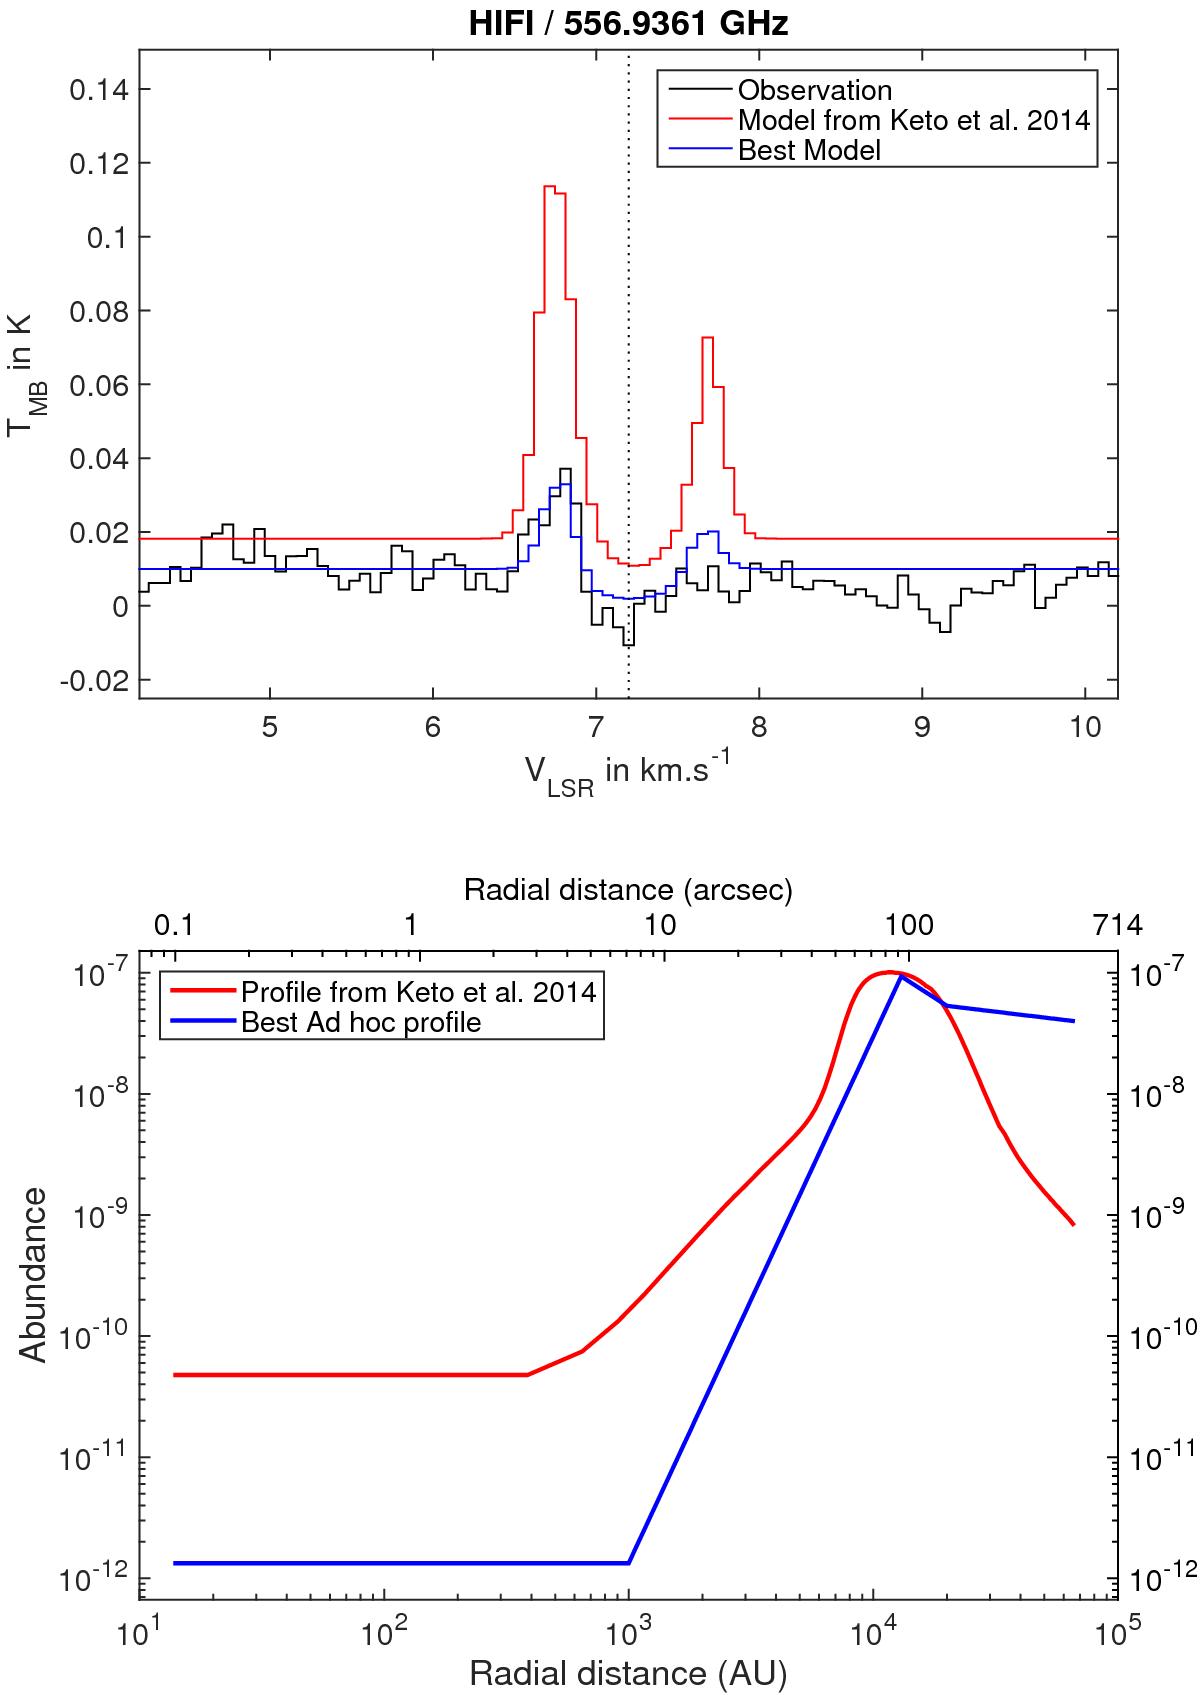
Top panel: comparison between observations and modelling obtained by LIME using the structure and abundance profile from Keto et al. (2014; in red). The best fit model is shown in blue, using the same structure but an ad hoc abundance profile. Bottom panel: abundance profile from Keto et al. (2014) in red and best fit ad hoc abundance profile in blue as a function of the radial distance from the core in arcsec (top axis) and AU (bottom axis).
Current usage metrics show cumulative count of Article Views (full-text article views including HTML views, PDF and ePub downloads, according to the available data) and Abstracts Views on Vision4Press platform.
Data correspond to usage on the plateform after 2015. The current usage metrics is available 48-96 hours after online publication and is updated daily on week days.
Initial download of the metrics may take a while.