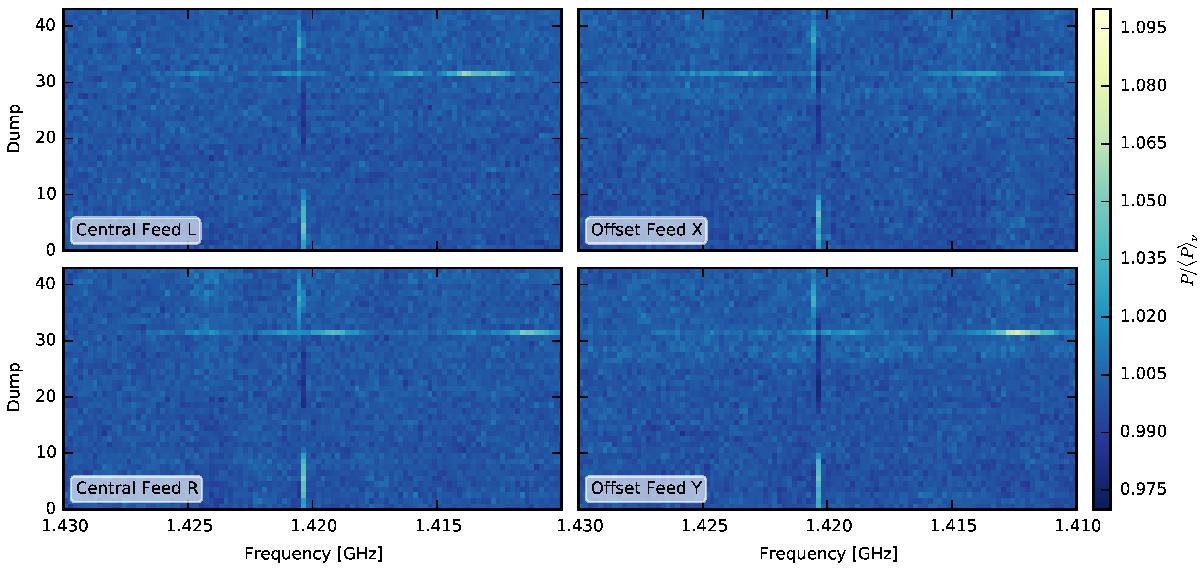
Fig. 3

Broadband RFI event, which is only visible in a single spectral dump (31). The left panels show the two polarizations (L and R) of the central feed, and right panels contain offset feed data (X and Y). For improved visualization, data is binned in frequency (32-fold, Δν = 195 kHz), and each spectral dump is divided by the median spectrum. The Milky Way H i emission line appears slightly displaced from its rest frequency owing to the LSR Doppler correction, which was not applied here.
Current usage metrics show cumulative count of Article Views (full-text article views including HTML views, PDF and ePub downloads, according to the available data) and Abstracts Views on Vision4Press platform.
Data correspond to usage on the plateform after 2015. The current usage metrics is available 48-96 hours after online publication and is updated daily on week days.
Initial download of the metrics may take a while.


