Fig. C.1
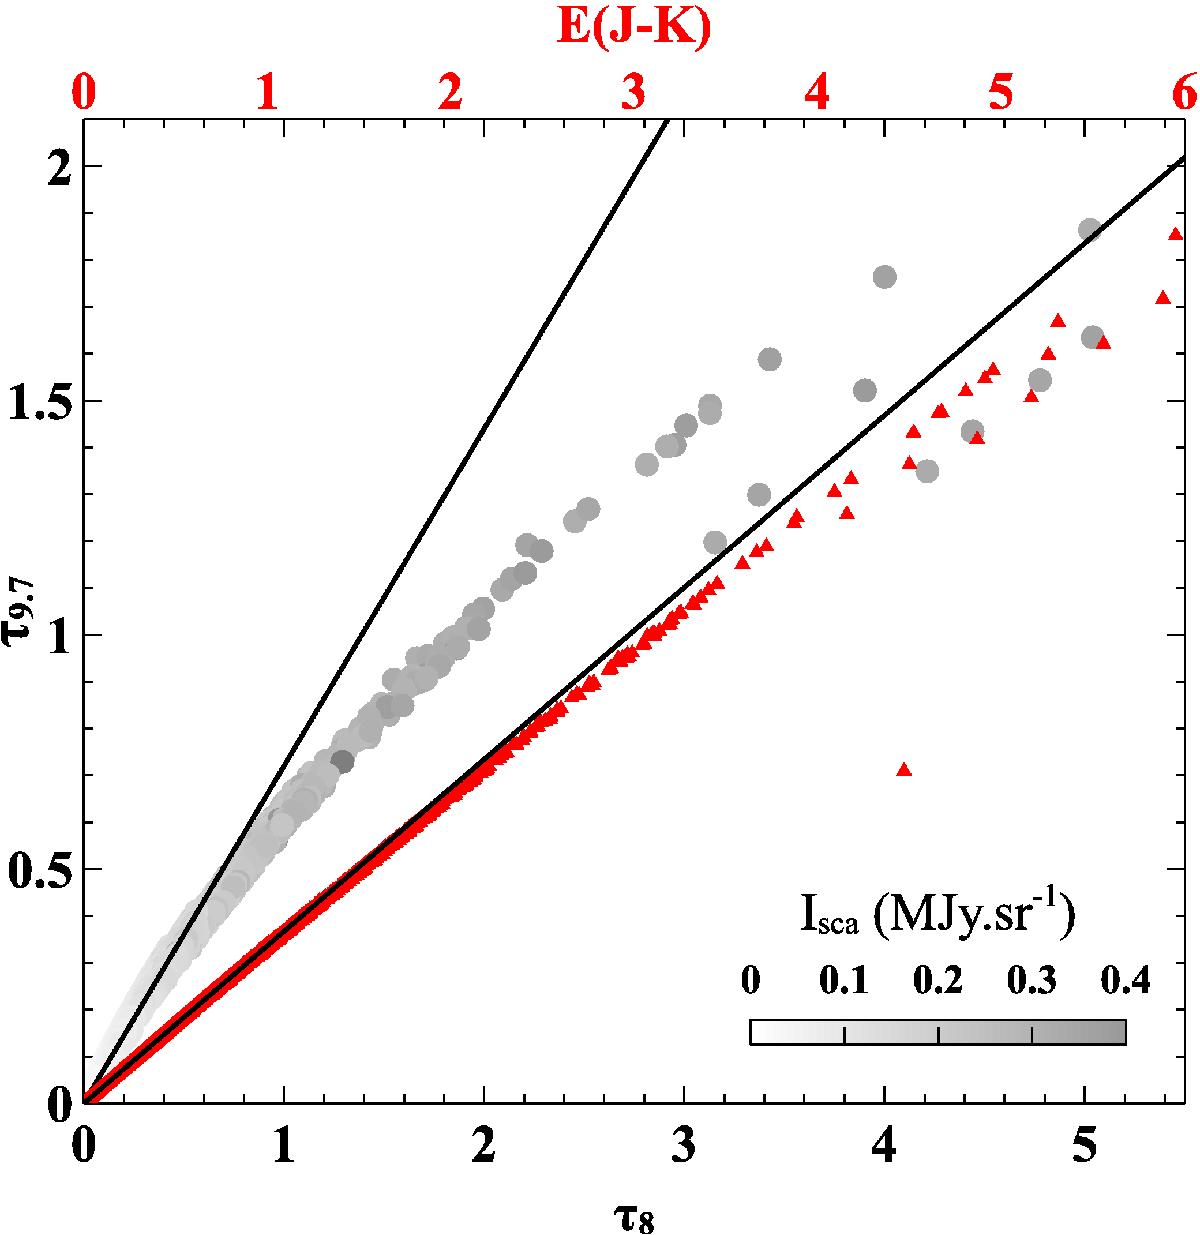
9.7 μm silicate absorption line opacities as a function of τ8 (gray circles). The color of the circles is related to the Isca strength. The 9.7 μm silicate absorption line opacities as a function of E(J − K) is represented by red triangles. All the values are obtained from the modeling and black lines correspond to the correlation obtained from diffuse interstellar lines of sight (Whittet 2003).
Current usage metrics show cumulative count of Article Views (full-text article views including HTML views, PDF and ePub downloads, according to the available data) and Abstracts Views on Vision4Press platform.
Data correspond to usage on the plateform after 2015. The current usage metrics is available 48-96 hours after online publication and is updated daily on week days.
Initial download of the metrics may take a while.