Fig. 4

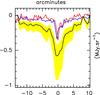
From left to right: 3.6 μm observations with subtracted background and stars (Δ3.6) compared to its modeling, and the same at 8 μm (Δ8). The black dashed line shows the horizontal cut through the core represented in the last panel. The red line corresponds to the profile from observations (Δ8), and the yellow filled shape displays modeling profiles without Isca for Ibg values ranging from 0.42 to 0.93 MJy sr-1. The black profile is the one example without Isca for Ibg = 0.58 MJy sr-1, and the blue one is the same model when including Isca.
Current usage metrics show cumulative count of Article Views (full-text article views including HTML views, PDF and ePub downloads, according to the available data) and Abstracts Views on Vision4Press platform.
Data correspond to usage on the plateform after 2015. The current usage metrics is available 48-96 hours after online publication and is updated daily on week days.
Initial download of the metrics may take a while.