Free Access
Fig. 1
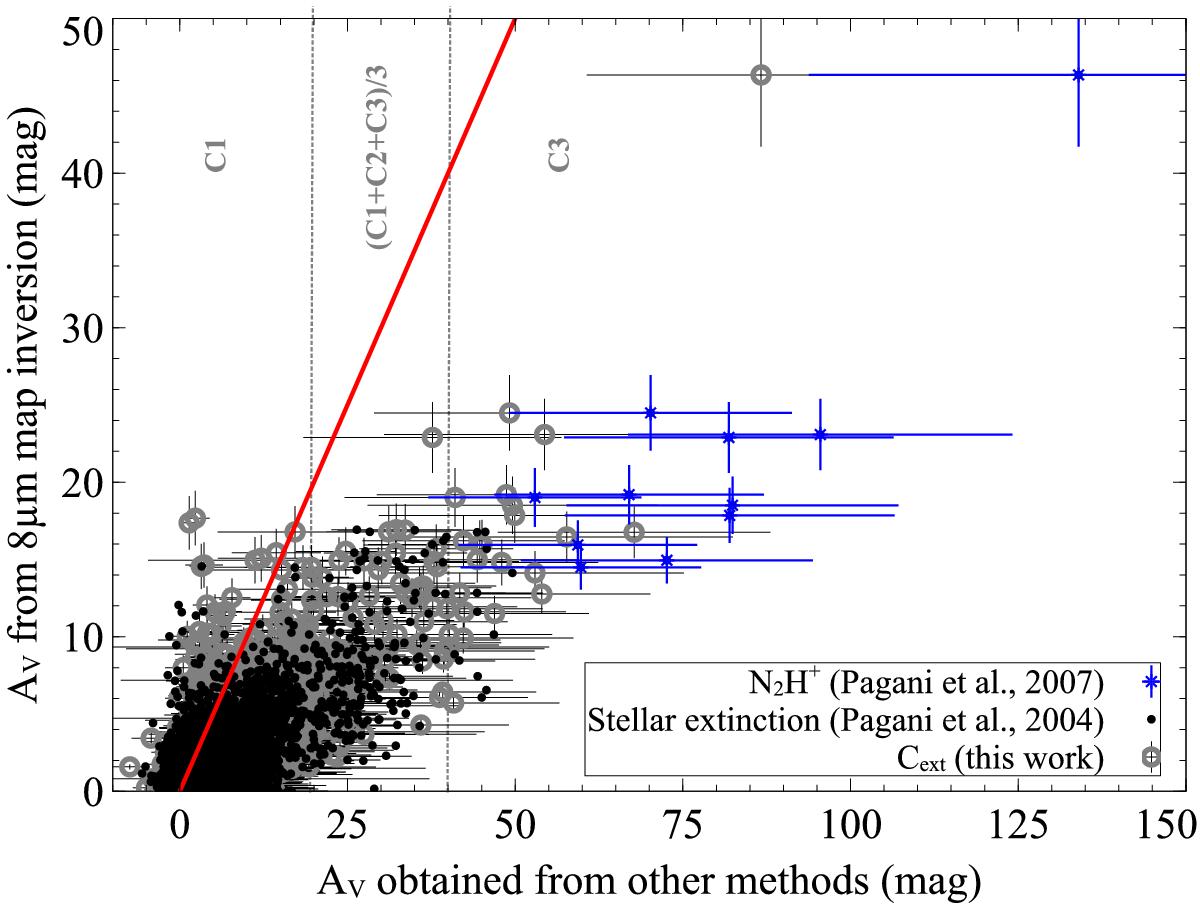
Comparison between AV obtained from different methods at the 20′′ resolution. The AV obtained from the 8 μm map inversion is associated to the highest peak value (Ibg,min = 0.42 MJy sr-1). The red line shows the one-to-one relation. Gray lines and C1, C2, C3 refer to the different catalogs used to build the extinction map.
Current usage metrics show cumulative count of Article Views (full-text article views including HTML views, PDF and ePub downloads, according to the available data) and Abstracts Views on Vision4Press platform.
Data correspond to usage on the plateform after 2015. The current usage metrics is available 48-96 hours after online publication and is updated daily on week days.
Initial download of the metrics may take a while.