Fig. 8
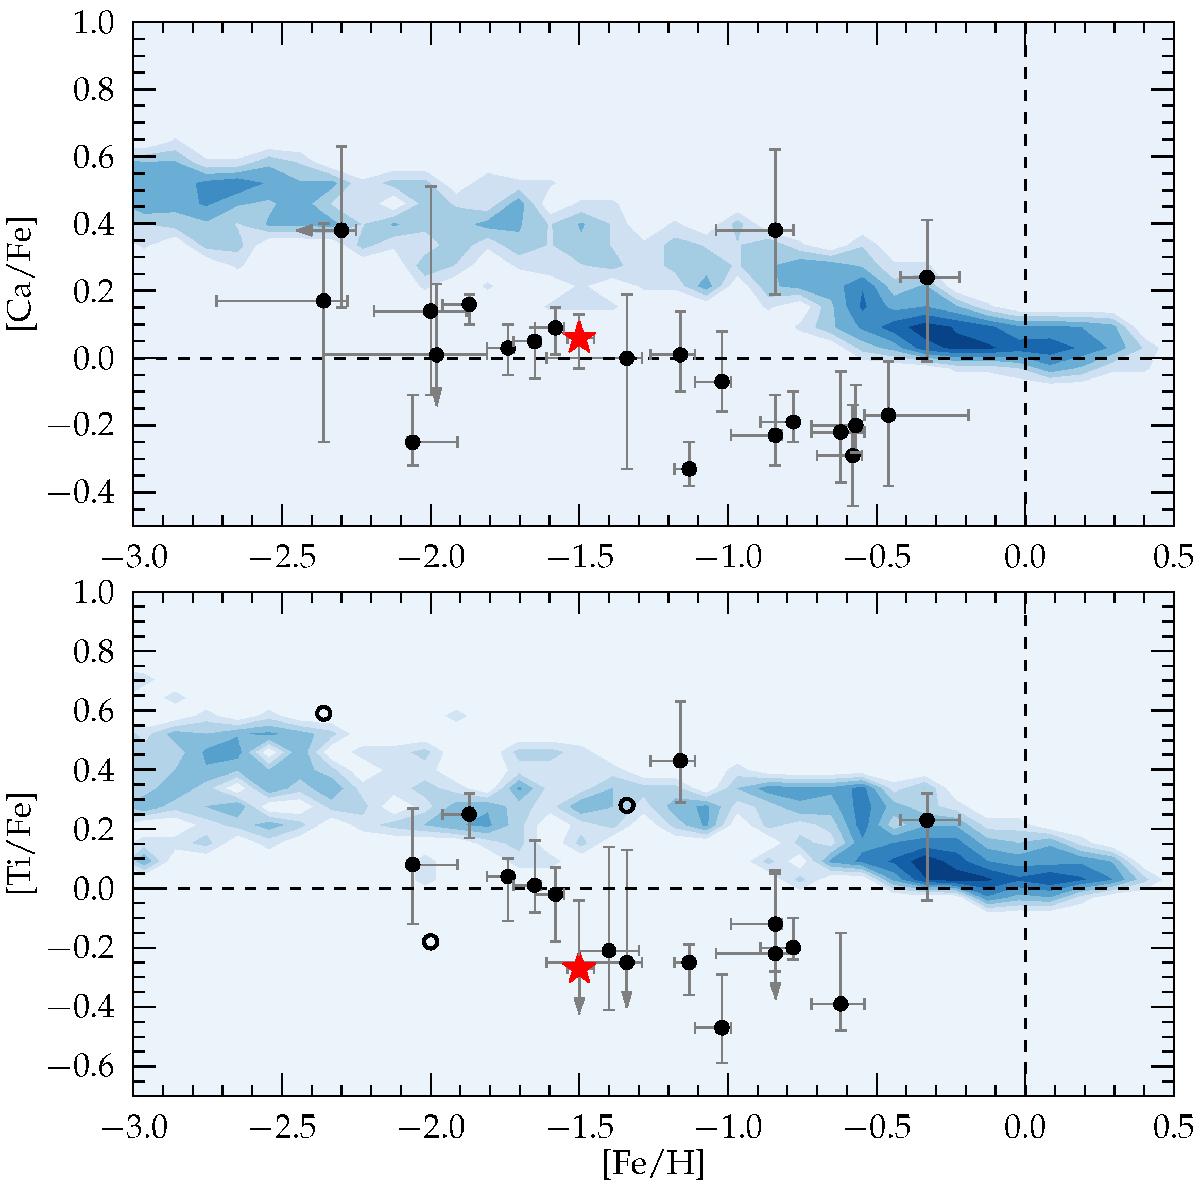
Chemical evolution of the alpha-elements Ca (upper panel) and Ti (lower panel) as a function of [Fe/H]. Black dots show the field stars in our sample and the red star highlights the GC H4 star. For visual comparison, the pattern of MW disc and halo stars are shown as a logarithmically-scaled number density distribution of arbitrary units (data from Venn et al. 2004 and Roederer et al. 2014). For both elements, we observe a clear sequence with [Fe/H], and in both cases the H4 member falls on top of this sequence and does not agree with the chemical abundance pattern seen in the MW. Open circles indicate objects for which SP_Ace could not find upper and lower abundance limits, either due to the low quality of the spectrum or because its chemical parameters fall close to the boundary of the allowed abundance grid.
Current usage metrics show cumulative count of Article Views (full-text article views including HTML views, PDF and ePub downloads, according to the available data) and Abstracts Views on Vision4Press platform.
Data correspond to usage on the plateform after 2015. The current usage metrics is available 48-96 hours after online publication and is updated daily on week days.
Initial download of the metrics may take a while.