Fig. 5
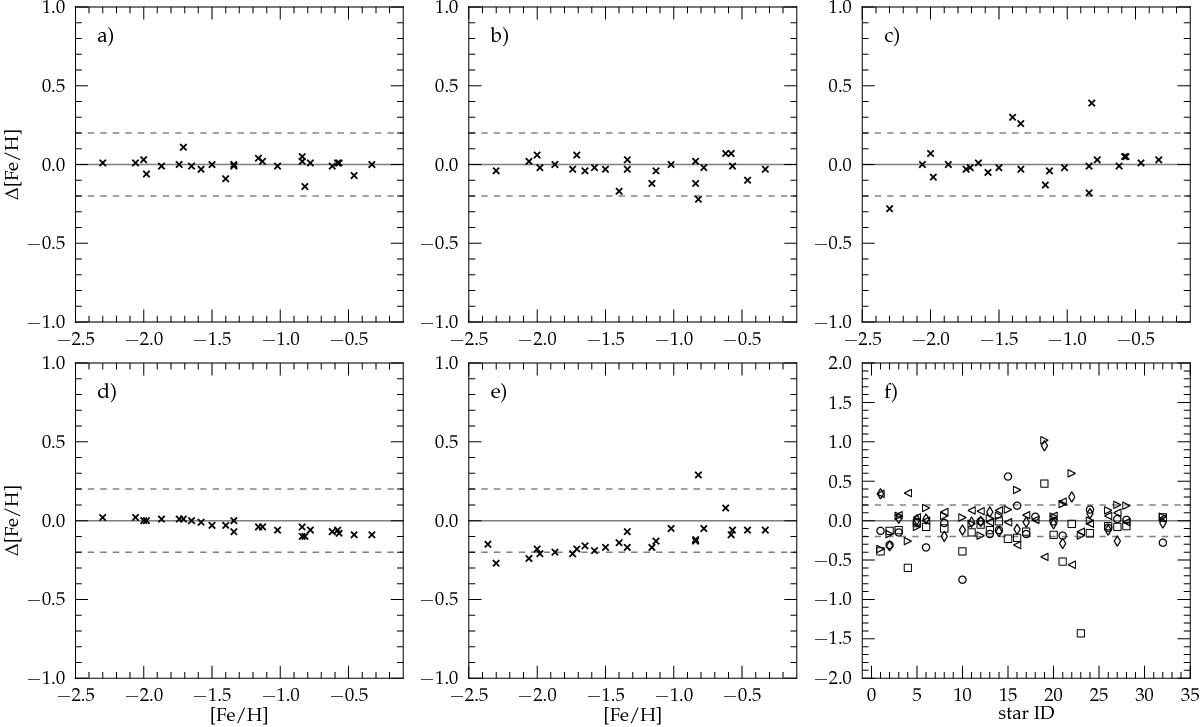
Consistency tests for chemical abundances derived with SP_Ace. All plots show the difference between the derived [Fe/H] and various changes to the spectrum as described in the text: a) with cosmic ray regions flagged out; b) with sky emission regions flagged out; c) adopting the initial resolution of R = 28 000; d) Δlog g = 0.3; e) ΔTeff = 200 K; f) all five orders analyzed separately (orders 52, 53, 54, 55, 56: circle, diamond, square, left-handed triangle, right-handed triangle). Given the limited wavelength range and the limited chemical information, not every individual order in each spectrum provides a result. Additionally, some orders in some stars are more affected by the different pixel masks and hence might show larger offsets.
Current usage metrics show cumulative count of Article Views (full-text article views including HTML views, PDF and ePub downloads, according to the available data) and Abstracts Views on Vision4Press platform.
Data correspond to usage on the plateform after 2015. The current usage metrics is available 48-96 hours after online publication and is updated daily on week days.
Initial download of the metrics may take a while.