Fig. 4
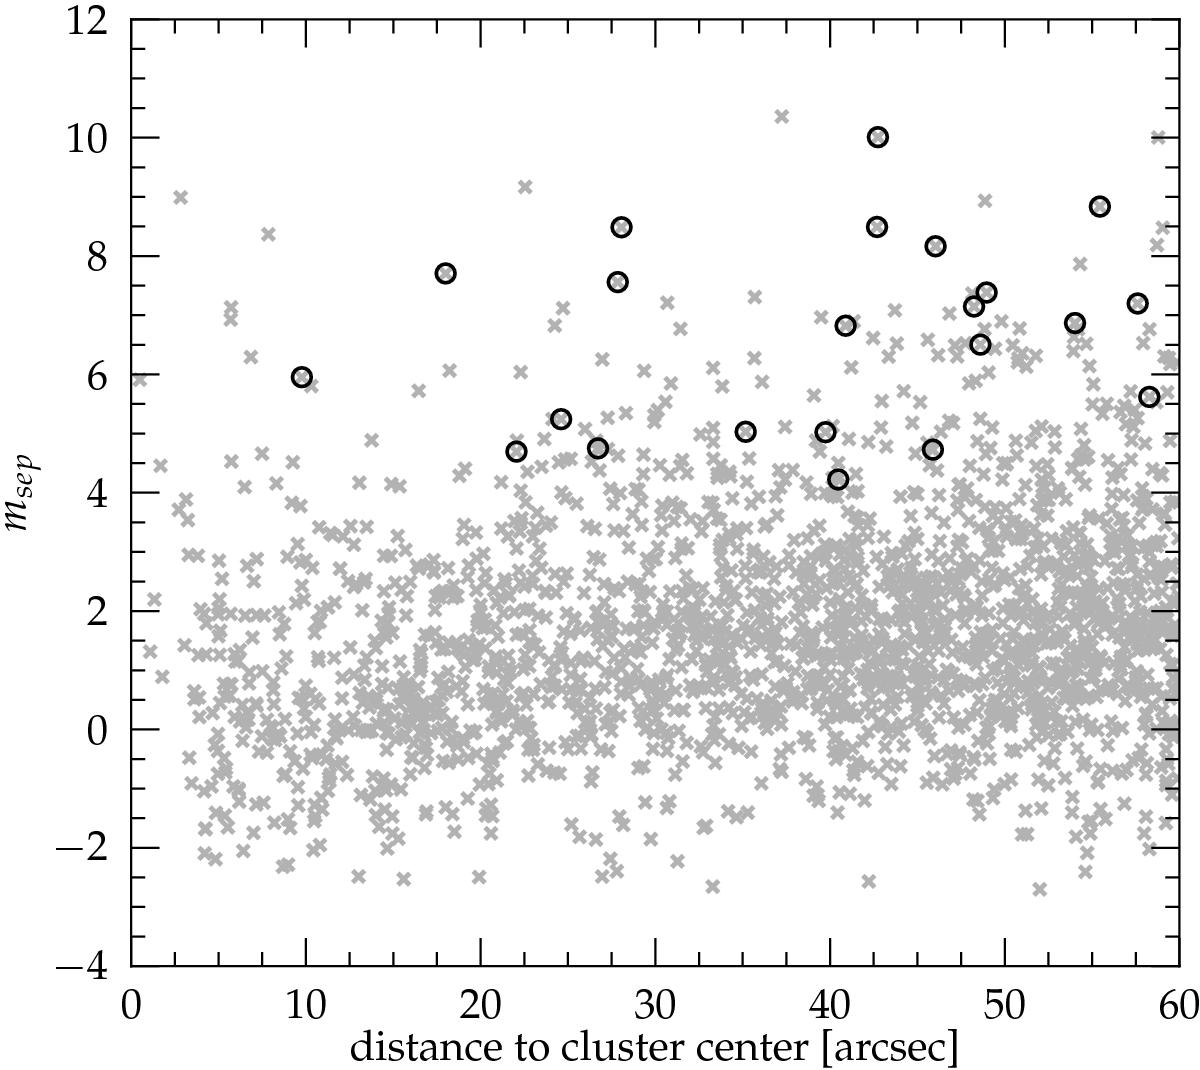
Plot of the separation index defined in the text for stars in the GC H4 as a function of central distance. Gray crosses denote all red giant stars projected on the sky near the cluster, and our targets are highlighted with black circles. While msep = 0.0 means that half of the star light comes from blending neighbors, msep = 4.0 and 5.0 means ~2.5% and 1.0% contamination, respectively.
Current usage metrics show cumulative count of Article Views (full-text article views including HTML views, PDF and ePub downloads, according to the available data) and Abstracts Views on Vision4Press platform.
Data correspond to usage on the plateform after 2015. The current usage metrics is available 48-96 hours after online publication and is updated daily on week days.
Initial download of the metrics may take a while.