Fig. 3
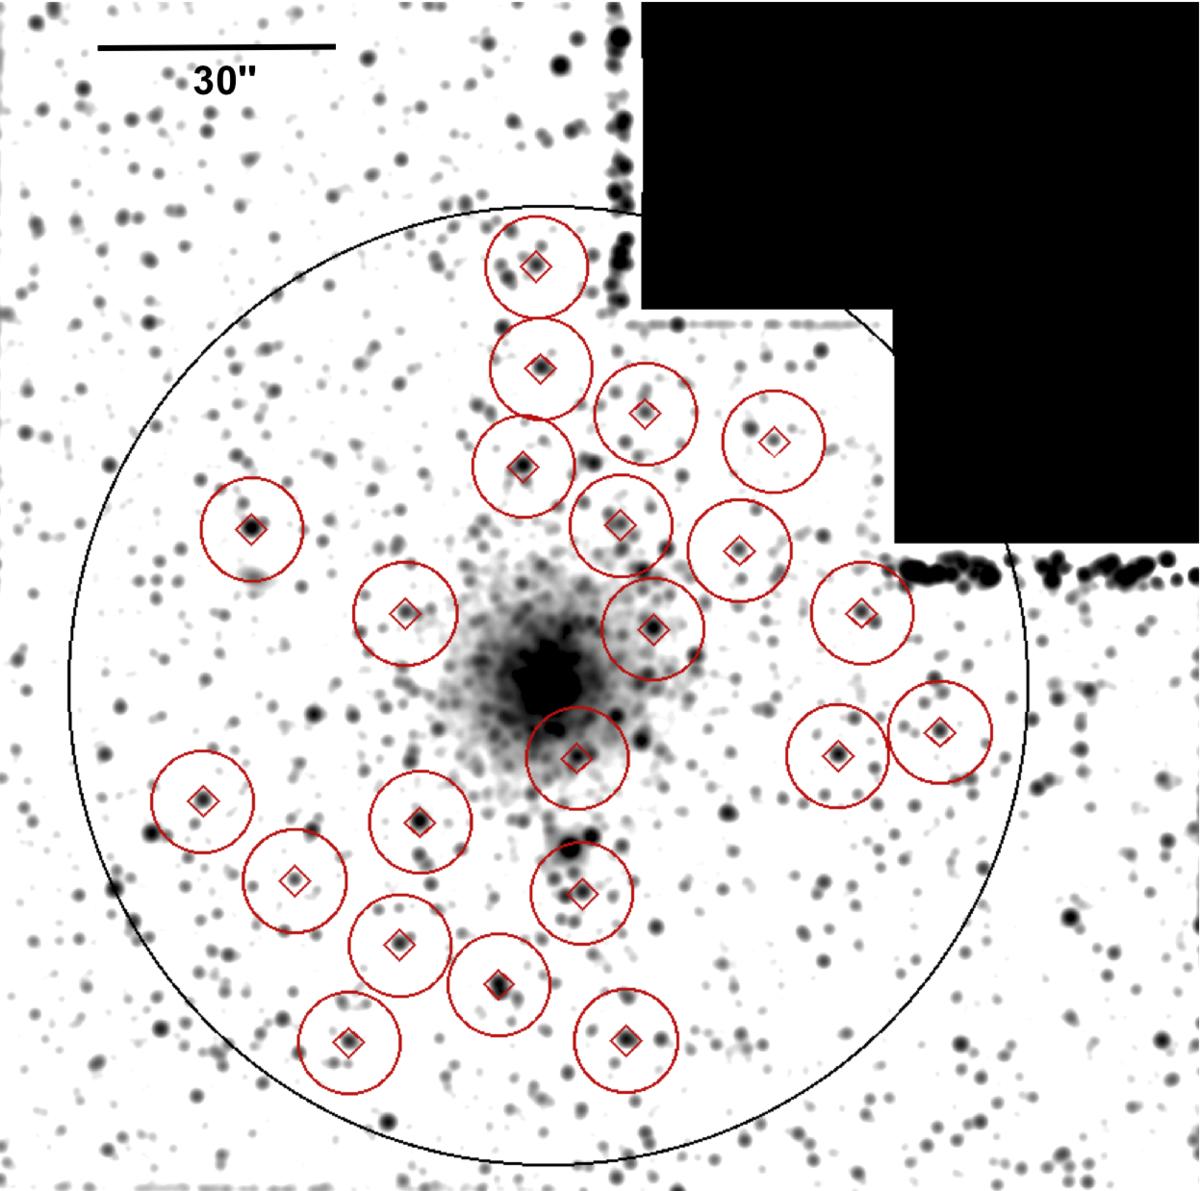
Location of our targets in the GC H4, shown on the WFPC2 F555W-band mosaic and artificially degraded to a ground-based seeing of 1″. The tidal radius of the cluster (rt = 1′) is shown in black and our targets are highlighted with red symbols. Red boxes are 2″ × 2″ and mimic the actual fibersize while the circles are 6.5″ in radius and visualize the minimum allowed spacing between individual fibers for M2FS.
Current usage metrics show cumulative count of Article Views (full-text article views including HTML views, PDF and ePub downloads, according to the available data) and Abstracts Views on Vision4Press platform.
Data correspond to usage on the plateform after 2015. The current usage metrics is available 48-96 hours after online publication and is updated daily on week days.
Initial download of the metrics may take a while.