Fig. 12
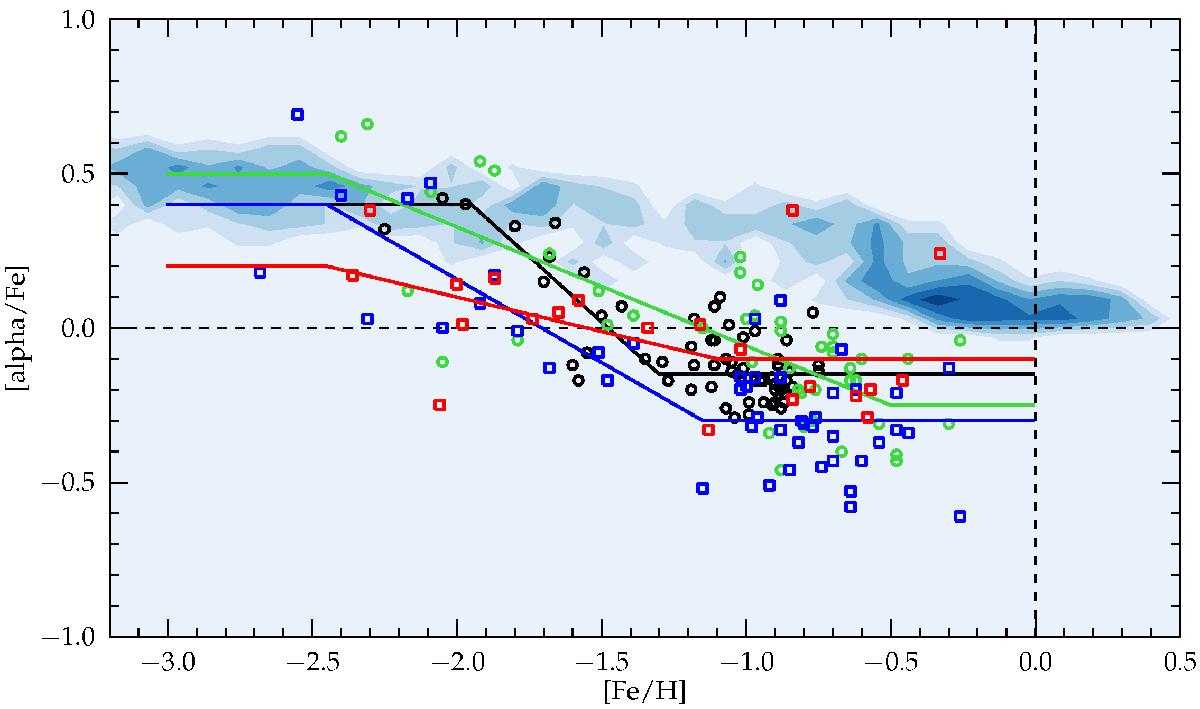
Fornax displays very similar chemical enrichment signatures at different radial positions within the galaxy. The evolution of individual alpha-elements is identical within the limited precision of the data. In detail, black circles are [Mg/Fe] measured at r ≈ 0.6° from Hendricks et al. (2014a), green circles and blue squares show [Mg/Fe] and [Ca/Fe] measured at r ≈ 0.6° from Lemasle et al. (2014), and red squares are the [Ca/Fe] values at r ≈ 0.2° from this work. The lines are toy model fits as described in the text to the samples with corresponding color. The contours show the evolution of MW field stars for comparison, averaged for Mg and Ca.
Current usage metrics show cumulative count of Article Views (full-text article views including HTML views, PDF and ePub downloads, according to the available data) and Abstracts Views on Vision4Press platform.
Data correspond to usage on the plateform after 2015. The current usage metrics is available 48-96 hours after online publication and is updated daily on week days.
Initial download of the metrics may take a while.