Fig. 10
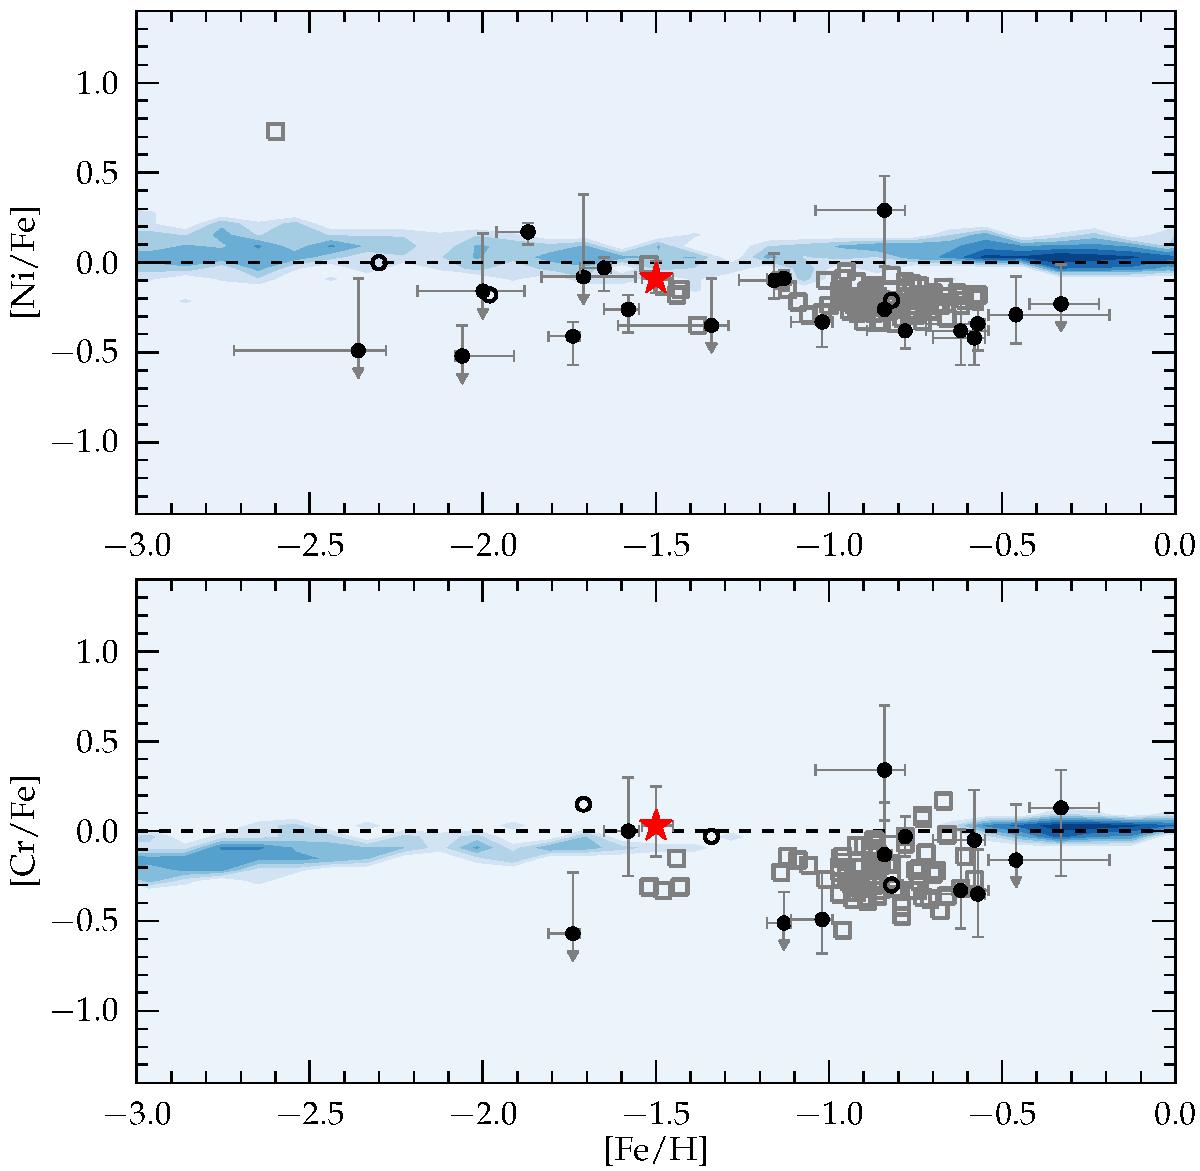
[Ni/Fe] and [Cr/Fe] as a function of [Fe/H]. As in Fig. 8, black dots show the field stars in our sample and the red star highlights the GC H4 star. Contours show the pattern of MW disc and halo stars (data from Venn et al. 2004; Roederer et al. 2014; Reddy et al. 2003, and Bensby et al. 2003). Open circles indicate objects for which SP_Ace could not find upper and lower abundance limits. Gray open squares are Fornax field star measurements from Letarte et al. (2010).
Current usage metrics show cumulative count of Article Views (full-text article views including HTML views, PDF and ePub downloads, according to the available data) and Abstracts Views on Vision4Press platform.
Data correspond to usage on the plateform after 2015. The current usage metrics is available 48-96 hours after online publication and is updated daily on week days.
Initial download of the metrics may take a while.