Fig. 1
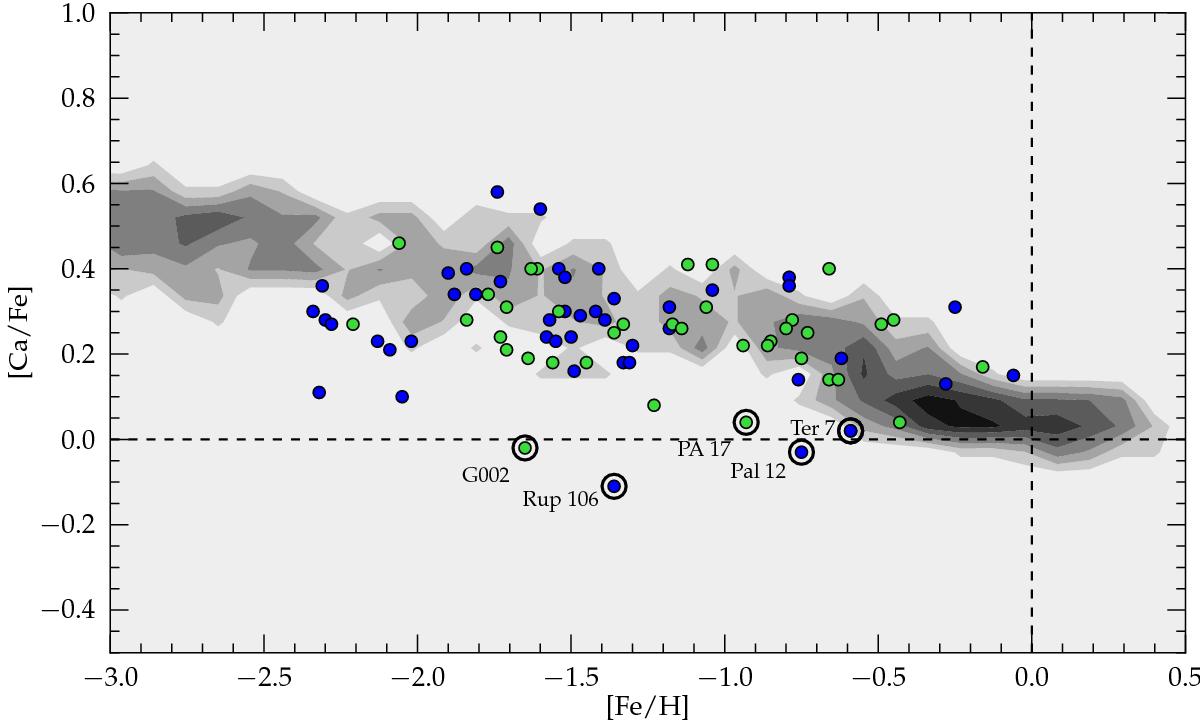
Literature compilation of the chemical abundance pattern of Ca as a function of [Fe/H]. Symbols show GCs in the MW from Pritzl et al. (2005; blue) and M31 (green) from Colucci et al. (2014) and Sakari et al. (2015). The pattern of MW disc and halo stars are shown as a logarithmically-scaled number density distribution of arbitrary units (data from Venn et al. 2004 and Roederer et al. 2014). Outliers with significantly lower [Ca/Fe] are highlighted with large open black circles.
Current usage metrics show cumulative count of Article Views (full-text article views including HTML views, PDF and ePub downloads, according to the available data) and Abstracts Views on Vision4Press platform.
Data correspond to usage on the plateform after 2015. The current usage metrics is available 48-96 hours after online publication and is updated daily on week days.
Initial download of the metrics may take a while.