Fig. 1
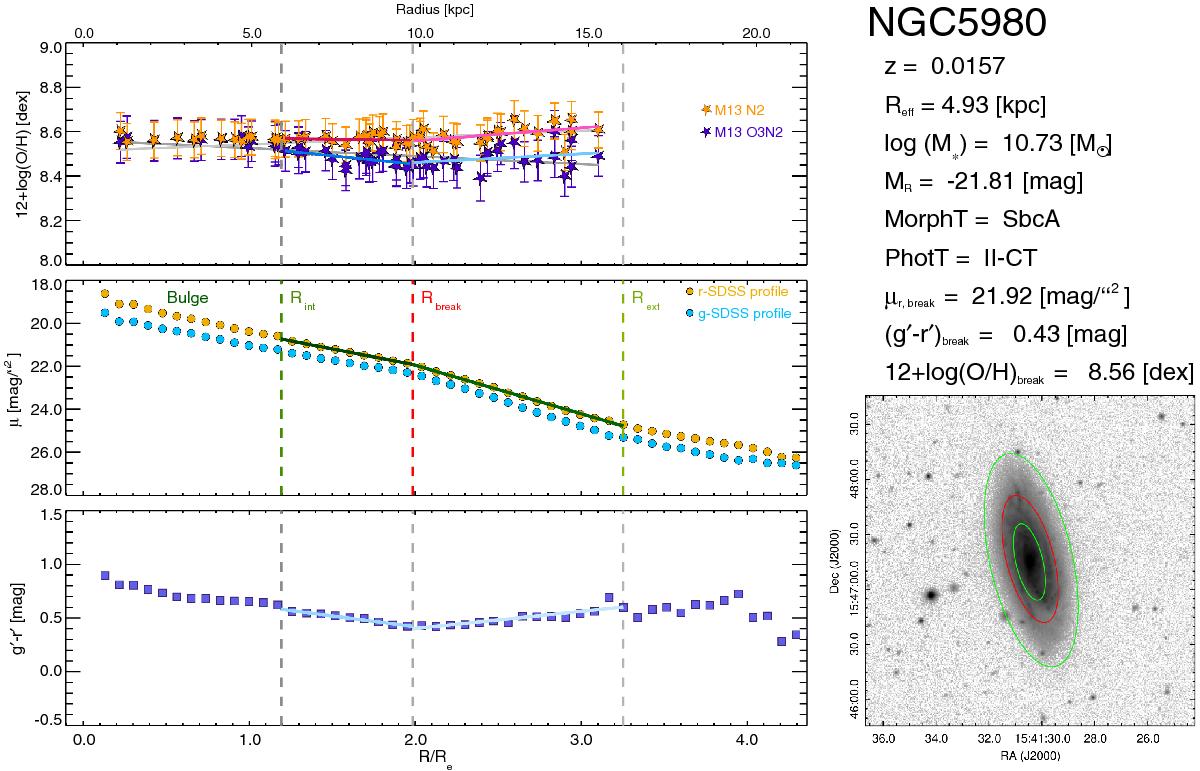
Radial ionized-gas metallicity, surface brightness, and color profiles of the CALIFA disks: example for galaxy NGC5980 showing a flattening beyond the break radius and the U-shaped color profile. Left: radial oxygen abundance profile is shown in the top row; filled purple stars represent the metallicity values obtained for each H ii region using the M13-O3N2 calibration (Marino et al. 2013) while the filled orange stars show those obtained via the M13-N2 calibration used in this work. The single fits of both profiles are drawn with gray solid lines. The double fits are plotted in red (inner part) and pink (outer part) for the M13-N2 case and blue (inner part) and cyan (outer part) for the M13-O3N2 case. The error bars plotted include both random and typical systematic errors associated with these calibrations. The SDSS SB profiles are shown in the second row: the r′-band profile is plotted with yellow circles and the g′-band profile with cyan circles. The double fit performed to the r′-band is indicated with a green solid line. The third row shows the (g′−r′) color gradient with violet squares and the double-linear fit is plotted with blue solid lines. The top x-axis shows the galactocentric radius in kiloparsecs, while the bottom shows the galactocentric radius normalized at Reff. The vertical dashed (in color only in the second panel) lines denote the inner radius (green), the break radius (red) and the outer radius (green) used in each SB double fit. Right: the physical properties derived for each galaxy, including the SB type, are listed at top right, while the SDSS 3′ × 3′r′-band postage stamp image is shown at bottom right. The overplotted ellipses correspond to the same radii used for the SB double fit. (The complete atlas of the 324 CALIFA galaxies analyzed is available at https://guaix.fis.ucm.es/~raffaella/Thesis_ATLAS/CALIFA_ATLAS.pdf.)
Current usage metrics show cumulative count of Article Views (full-text article views including HTML views, PDF and ePub downloads, according to the available data) and Abstracts Views on Vision4Press platform.
Data correspond to usage on the plateform after 2015. The current usage metrics is available 48-96 hours after online publication and is updated daily on week days.
Initial download of the metrics may take a while.