Fig. 2
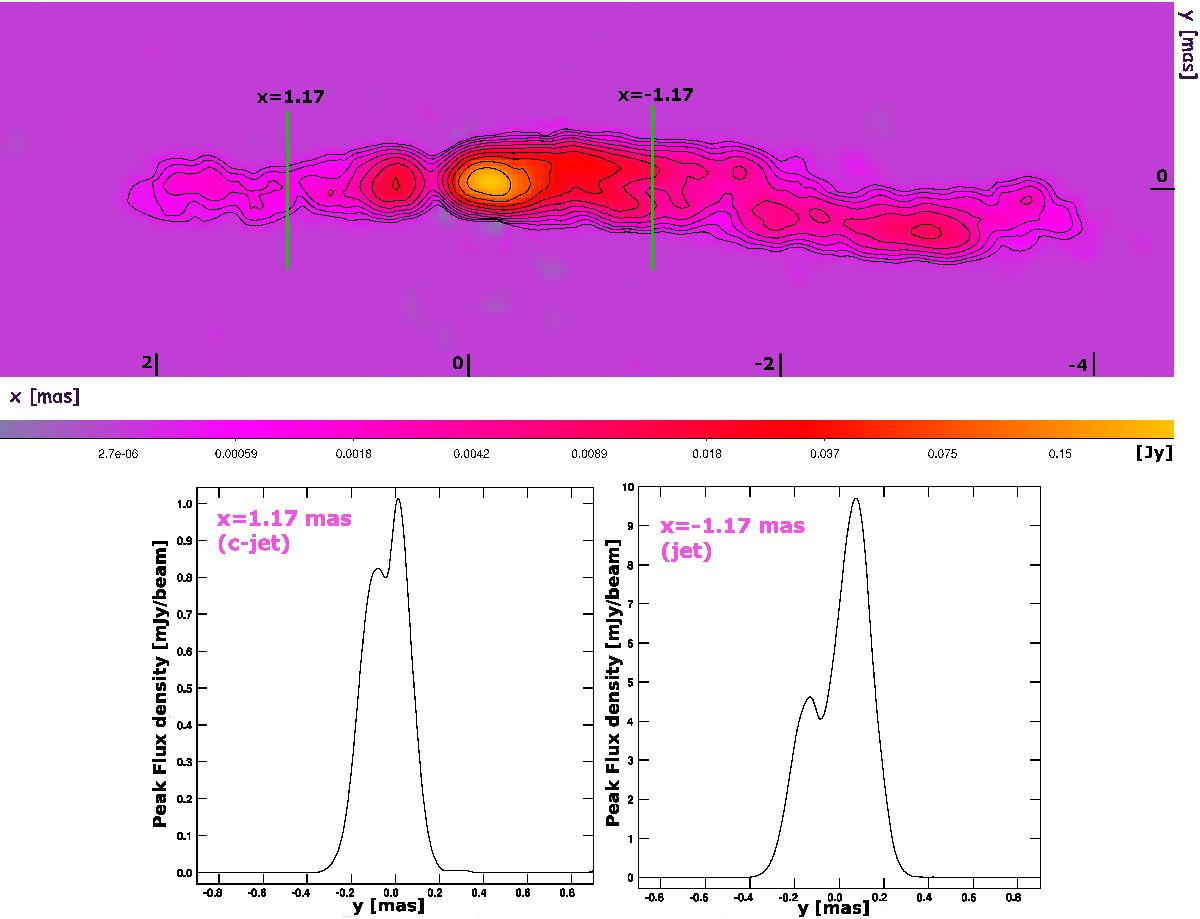
Top: Stacked 43 GHz image from observations in 2007−2009, rotated by 16° clockwise. It is convolved with a circular beam of 0.15 mas. Contours represent isophotes at 0.3, 0.6, 1.2, 2.4, 4.8, 9.6, 19.2, 38.4, 76.8, and 153.6 mJy/beam. The four maps were aligned to the position of component N, as shown in Fig. 1. Bottom: double peaked intensity profiles at the location of the cuts indicated in the top image.
Current usage metrics show cumulative count of Article Views (full-text article views including HTML views, PDF and ePub downloads, according to the available data) and Abstracts Views on Vision4Press platform.
Data correspond to usage on the plateform after 2015. The current usage metrics is available 48-96 hours after online publication and is updated daily on week days.
Initial download of the metrics may take a while.